TRENT trade ideas

Bullish NSE:TRENTBuy = 1060
SL = 1005
Target 1 = 1170
Target 2 = 1225
03/10/2021
Bullish NSE:TRENT-->Trent Ltd
Buy for short term

Buy Setup with Good Risk/Reward Trend has a breakout Today. Buy Trent between 990-1000 with SL 920 for targets 1100 and 1200 in next 1-2 months.
Disclaimer :
Trading is never ever recommended as it is injurious to mankind. This is purely my study based on technical charts and for educational purpose only. Please do your analysis before taking any trades given by me. I MUST not be held responsible for any profit or loss out of any trades you take on our advice. All Disclaimers Apply.

TRENT - A bullish setup Look at the last 11 candles
Every bear candle has been absorbed
and negated by bulls.

Long TrentStock following trend line beautifully....
Important levels marked on the chat.
NSE:TRENT
Education purpose only.

Long Trent above 905 for 950+Important levels marked on the chart.
This is my personal view and not reco.
Education purpose only.

TrentAdd in your watchlist, Trading near Breakout zone.
1. Daily RSI Near 60
2. RSI +ve
3. Above ichimoku cloud
4. Above 50, 100 and 200 EMA.


Trent looking bullishTrent Ltd. stock has given trendline breakout with good volumes which can also be seen as a flag pole pattern. Also, The stock has given a very good weekly closing.
The stock can be a good buy for intraday above 910.
Also, one can expect nearly 10% targets in a swing trade if the ATH levels are crossed.
This is just for educational purpose.


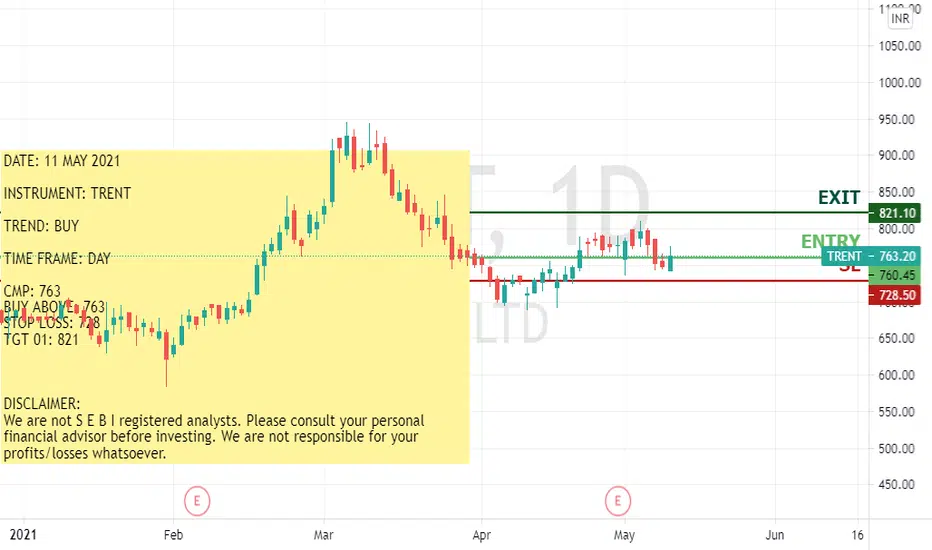
TRENT ::: LONGDATE: 11 MAY 2021
INSTRUMENT: TRENT
TREND: BUY
TIME FRAME: DAY
CMP: 763
BUY ABOVE: 763
STOP LOSS: 728
TGT 01: 821
DISCLAIMER:
We are not S E B I registered analysts. Please consult your personal financial advisor before investing. We are not responsible for your profits/losses whatsoever.

RSI Bullish Divergence in NSE: TRENT 1D Chart In TRENT, there was a down-trend. Now, down-trend is over and a new trend is getting established.
There is RSI Bullish Divergence in 1D Chart. Stock may come down a bit in short team (like next 1 week).
Overall, if the new trend establishes itself, stock may go up in mid-term.

TRENT BUY AT 750. TARGET 825. SL 690. HOLD FOR 3 MONTHS# The sharp trended decline in TRENT seems to have completed, as the stock price has bounced up from the lower support of 700 levels in this week.
# We observe a formation of bullish hammer type weekly candle pattern in last week and upside bounce in this week which signal bottom reversal in the stock price around
700.
# We also observe a larger degree positive sequence like higher tops and bottoms over the last few months. The recent swing low of 689-12th April could be considered as a
new higher bottom of the sequence.
# Weekly 14 period RSI shows positive indication. Hence, one may expect further strengthening of upside momentum in the stock price ahead.
# The overall chart pattern of TRENT indicate long trading opportunity. One may look to create a positional long as per the levels mentioned above.


Trent - Intraday Trade SetupTrent CMP - 799.20
Looking bullish in higher time frame. One can go for Intraday Trade Setup with the following entry, exit & targets.
*Buy* At or Above 805.50 / Stop Loss 797
Target 1 - 810
Target 2 - 815
Target 3 - 820
Disclaimer: This is my view and for educational purpose only.


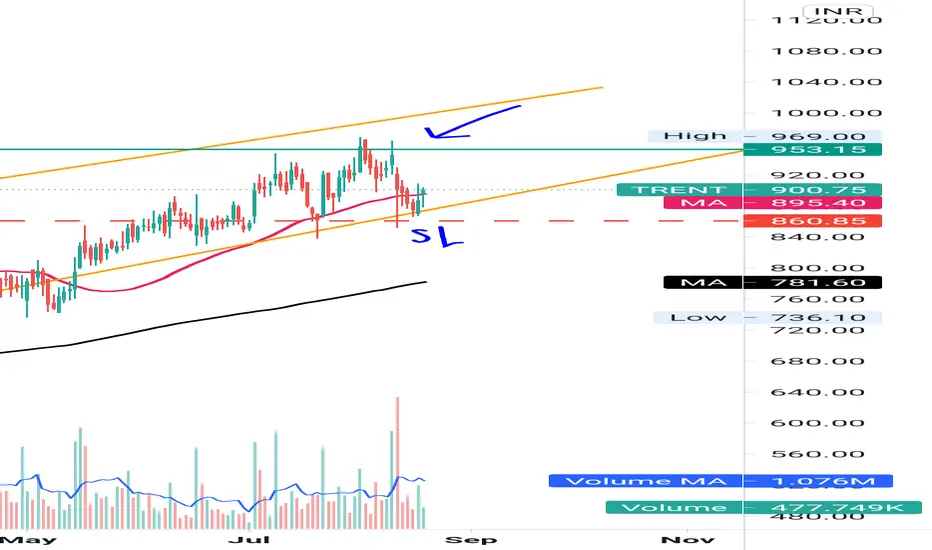
TRENT - ASCENDING CHANNEL + 50EMA Support - SWINGThe above analysis is done purely on basis of Price Action & Chart Patterns.
The analysis is done on daily TF hence price may take few days to few weeks in order to reach the targets
Logic, Entry range, SL and Targets are shown in image itself.
The above analysis is purely for educational purpose. Traders must do their own study before entering into any trade. Traders must trade as per their own risk taking capacity and money management.
Check out related ideas for easy understanding of how similar setup works and how a beginner can find good swing trades on his own by following this setup with good risk-to-reward ratio.
(1) JKCEMENT
(2) PIIND
(3) MASFIN
(4) CRISIL
(5) Previous Analysis of TRENT
Similar opportunity in MASFIN -
Also check out my other ideas to understand how price action works and how it can be used to make regular profits without any complex strategies.
Feel Free to comment for any queries regarding the above stock or price action analysis in general.


TRENT - Three candles Bullish Reversal (Morning Star)- SwingThis analysis is done purely on basis of price action and chart patterns
Analysis is done on Daily TF hence it may take few days to few weeks for price to reach the given target
Logic as well as the strategy for the trade setup is explained in the image itself.
Pls note that this is not a trade recommendation. Do your own study before entering into any trade.
Trade with your own risk & money management.
Feel Free to comment for any query or suggestions
Check out other reversal patterns in following ideas -
(1) HDFC - Mother-Baby (Bullish-Harami) Pattern
(2) VINATI ORGANICS - Morning Star Reversal Pattern.
