TRIVENI trade ideas
#TRIVENI Date: 22-05-2025
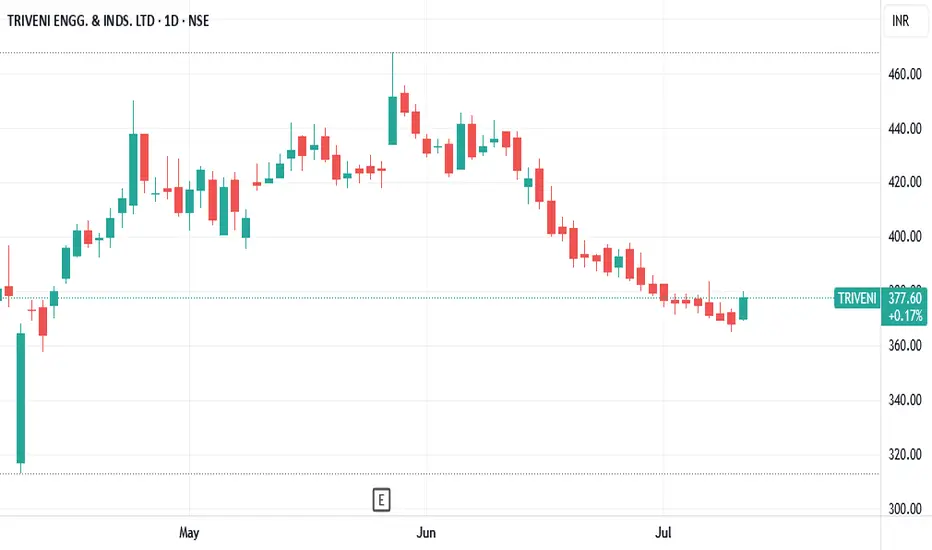
Current Price: 423.40
Mid-Point: 423.48
Upside Targets: 435.73, 441.38, 448.09 and 454.80
Downside Targets: 411.24, 405.58, 398.86 and 392.15
Support: 416.91
Resistance: 430.09
#TRIVENI

Triveni LongTriveni Looks to be Long if cross above 514. Moving in the same channel since April. So almost 9 months in the range..

TRIVENI ENGG. & INDS LTD S/RSupport and Resistance Levels:
Support Levels: These are price points (green line/shade) where a downward trend may be halted due to a concentration of buying interest. Imagine them as a safety net where buyers step in, preventing further decline.
Resistance Levels: Conversely, resistance levels (red line/shade) are where upward trends might stall due to increased selling interest. They act like a ceiling where sellers come in to push prices down.
Breakouts:
Bullish Breakout: When the price moves above resistance, it often indicates strong buying interest and the potential for a continued uptrend. Traders may view this as a signal to buy or hold.
Bearish Breakout: When the price falls below support, it can signal strong selling interest and the potential for a continued downtrend. Traders might see this as a cue to sell or avoid buying.
MA Ribbon (EMA 20, EMA 50, EMA 100, EMA 200) :
Above EMA: If the stock price is above the EMA, it suggests a potential uptrend or bullish momentum.
Below EMA: If the stock price is below the EMA, it indicates a potential downtrend or bearish momentum.
Trendline: A trendline is a straight line drawn on a chart to represent the general direction of a data point set.
Uptrend Line: Drawn by connecting the lows in an upward trend. Indicates that the price is moving higher over time. Acts as a support level, where prices tend to bounce upward.
Downtrend Line: Drawn by connecting the highs in a downward trend. Indicates that the price is moving lower over time. It acts as a resistance level, where prices tend to drop.
Disclaimer:
I am not a SEBI registered. The information provided here is for learning purposes only and should not be interpreted as financial advice. Consider the broader market context and consult with a qualified financial advisor before making investment decisions.

Triveni Engineering - Positional Trade Idea Triveni Engineering - Positional Trade Idea 🚀
📈 Breakout Retest Opportunity
Triveni Engineering is showing strong bullish momentum as it reclaims key resistance levels near ₹485 on the weekly chart, supported by increasing volume.
Entry Zone: ₹485-490
Target 1: ₹540
Target 2: ₹600
Stop-loss: ₹450
RSI at 62 confirms strength, while trend indicators suggest continuation of the upward trajectory.
#TriveniEngineering #BreakoutTrade #PositionalTrading #NSE

TRIVENI: Abki Baar 500 Paarr??🎯 The chart is self-explanatory as always.
🎯 Breakout of a beautiful contraction pattern
🎯 Price sustains the breakout price point with Dojis
🎯 A huge green momentum candle with good volume seals it up
🎯 I like this price structure
⚠️Disclaimer: We are not registered advisors. The views expressed here are merely personal opinions. Irrespective of the language used, Nothing mentioned here should be considered as advice or recommendation. Please consult with your financial advisors before making any investment decisions. Like everybody else, we too can be wrong at times.

Multiple Indicator - TRIVENI📊 Script: TRIVENI
📊 Sector: Sugar
📊 Industry: Sugar
Key highlights: 💡⚡
📈 Script is trading at upper band of BB and giving breakout of it.
📈 MACD is giving crossover .
📈 Double Moving Averages are giving crossover.
📈 Right now RSI is around 71.
📈 One can go for Swing Trade.
⏱️ C.M.P 📑💰- 426
🟢 Target 🎯🏆 - 451
⚠️ Stoploss ☠️🚫 - 416
⚠️ Important: Always maintain your Risk & Reward Ratio.
✅Like and follow to never miss a new idea!✅
Disclaimer: I am not SEBI Registered Advisor. My posts are purely for training and educational purposes.
Eat🍜 Sleep😴 TradingView📈 Repeat 🔁
Happy learning with trading. Cheers!🥂

Golden Crossover - TRIVENI📊 Script: TRIVENI
📊 Sector: Sugar
📊 Industry: Sugar
Key highlights: 💡⚡
📈 Golden Crossovers are seen into this Script.
📈 Golden Crossover is where slow moving average line crosses fast moving average above.
📈 Although Script is trading at All Time High we may see some bullish rally.
⏱️ C.M.P 📑💰- 417
🟢 Target 🎯🏆 - 461
⚠️ Important: Always maintain your Risk & Reward Ratio.
✅Like and follow to never miss a new idea!✅
Disclaimer: I am not SEBI Registered Advisor. My posts are purely for training and educational purposes.
Eat🍜 Sleep😴 TradingView📈 Repeat 🔁
Happy learning with trading. Cheers!🥂

TRIVENI ENGINEERING - STRONG TECHNICALLYTRIVENI ENGINEERING
The stock has a good history of technical breakouts making it to go up almost 300% twice and now being currently in the rise, there is good opportunity right now as it's being alongside at the support and breaking out of a channel consolidation too presenting a favorable entry with STOPLOSS below the support levels which would be around 15% which might sound too much but the stock has all the potential to go up to the TARGETS anywhere between 40-50% on the upside or least of 20% which is still a good catch so do consider adding this in your watchlist and plan the trade accordingly.

Strong Buy TRIVENI ENGINEERIN Target 411.Buy zone 320-330The 4 analysts offering 1 year price forecasts for TRIVENI ENGINEERIN have a max estimate 479.00 , min estimate of 340.00 and a average estimate of 411.00.Buy zone 320-330
Be warned: -
This info isn’t a recommendation for what you should personally do, so please don’t take the data as investment advice’s with any Tarde, always look first, then leap.

Strong Buy TRIVENI ENGINEERIN Target 411. Buy zone 320-330 The 4 analysts offering 1 year price forecasts for TRIVENI ENGINEERIN have a max estimate 479.00 , min estimate of 330.00 and a average estimate of 411.00.Buy zone a average estimate 332-330
Be warned: -
This info isn’t a recommendation for what you should personally do, so please don’t take the data as investment advice’s with any Tarde, always look first, then leap.

Good result & good setupHigh RS on weekly/Monthly
123 shapper, TTM sqeeze BO
with PP volume, cheat entry

TRIVENI ENGINEERING ( Mother & Baby Rising Wedge )Triveni Engineering, Monthly chart making Mother & Baby Rising Wedges
For Fresh entry , wait for Baby rising wedge breakout with good volume and RSI > 60 , with EMA 10> 20>50>200

Baby Steps Pattern-TriveniBaby Steps Pattern- High Probability of Good Up-Move.
This is only for Educational Purpose.
Not a Buy/Sell Call.
Do your own Research! (DYOR)

TRIVENI DAILY CHARTTRIVENI DAILY CHART
Breakout @ 300 Target @ 405
TRIVENI has witnessed a trend line breakout along with resistance breakout @ 300 levels.
Its only an observation & not any suggestion.


Triveni Engineering starting long term wave 5This is Triveni Engineering (NSE:TRIVENI) quarterly chart. In the chart I have marked the long term impulse wave counts in yellow, and internal fractals in orange (impulses) and red (corrective).
It feels really good when you see such clean, textbook wave counts as they reinforce your confidence into Elliott wave theory and it’s practicality. I haven’t shared many charts lately but this was kind of chart I couldn’t resist sharing.
We can see that long term wave 4 seem to be complete after ABC correction and since the high of wave 3 is taken out, which given additional weightage to the view that we are in long term wave 5. I have marked the internal fractals for clarity of wave counts. Now, if we go by the wave equality principle then wave 5 should be equal to wave 1 which gives us a potential target around 2200. Stock is currently trading around 382.
Note that, wave 3 is larger than wave 1 which is why it makes sense to take quality between 1 and 5. If wave 3 was shorter than wave 1 then 5th wave would be even shorter than 3 and we can’t use equality. Remember that wave 3 cannot be shortest.
Disclaimer: Purpose of this post is to educate on technical analysis methodologies and not giving trading/investing advice.

Close to Resistance. Need to watch Carefully. Stock gave weekly closing near the Resistance. Need to watch Carefully, If broken above stock will be heading to new highs. if its not broken, might come to center of channel.

Ready for next really #baapofbreakoutEntry CMP
STOP losss 299
Breakout trading implementation:
1. **Identifying New Trends:** Breakout trading helps traders identify the beginning of new trends by focusing on price levels where an asset breaks out of its historical trading range.
2. **Volatility Indicator:** Breakouts often occur when there's increased volatility in the market. Monitoring breakouts can provide insights into shifts in market sentiment and potential price movements.
3. **Entry Points:** Breakout points serve as potential entry points for traders looking to ride the momentum of a newly established trend. Buying on a breakout can capture the early stages of a price movement.
4. **Confirmation of Strength:** Successful breakouts indicate the strength of a trend. If an asset breaks out with high volume and follows through with sustained price movement, it suggests a strong trend in that direction.
5. **Avoiding False Signals:** Breakout strategies often include using indicators or confirmation signals to avoid false breakouts. This can enhance the accuracy of trade decisions.
6. **Defined Risk and Reward:** Breakout trading allows for setting clear stop-loss levels below the breakout point, which helps manage risk. Traders can also calculate potential profits based on the distance between the breakout point and a projected target.
7. **Adaptable to Various Markets:** Breakout trading can be applied to various markets, including stocks, forex, commodities, and cryptocurrencies. The concept remains consistent across different assets.
8. **Flexibility:** Traders can adapt breakout strategies to their preferred timeframes, whether they are day traders, swing traders, or long-term investors.
9. **Liquidity Opportunities:** Breakout points are often associated with increased trading volume, which can provide better liquidity for executing trades.
10. **Risk vs. Reward Assessment:** Traders can evaluate the potential risk of a trade (stop-loss) against the potential reward (target price), aiding in decision-making and portfolio management.
11. **Psychological Advantage:** Successful breakout trades can boost a trader's confidence and discipline, reinforcing the effectiveness of their strategy.
12. **Market Events:** Breakouts can occur around significant market events such as earnings reports, economic data releases, or geopolitical developments, offering traders opportunities to capitalize on sudden price movements.
Remember, while breakout trading offers potential advantages, it also carries risks. False breakouts and market reversals can lead to losses. Successful implementation requires a solid understanding of technical analysis, risk management, and the ability to adapt to changing market conditions.

28.89% UPSIDE POTENTIAL IN TRIVENI ENGBreakout of H&S pattern has been done on TRIVENI ENGINEERING.
wait for the retest at the marked level to take it to the upside.
Target - 400

TRIVENI BREAKOUT RETESTNSE:TRIVENI
TRIVENI breakout retest gets completes once stock gives daily closing above 307

Traingle breakout Ascending traingle chart breakout
Triveni Engineering & Industries Ltd on Tuesday, July 25, reported a 1.7 percent year-on-year (YoY) increase in net profit at Rs 67.6 crore for the first quarter that ended June 30, 2023. Result is super and chart breakout

TRIVENI 200+ days consolidation Breakout with Volume NSE:TRIVENI - gave a breakout above 200+ days with 6.72% surge in breakout candle confluences with huge volume. Likely breakout sustains and give a clean upside momentum..
