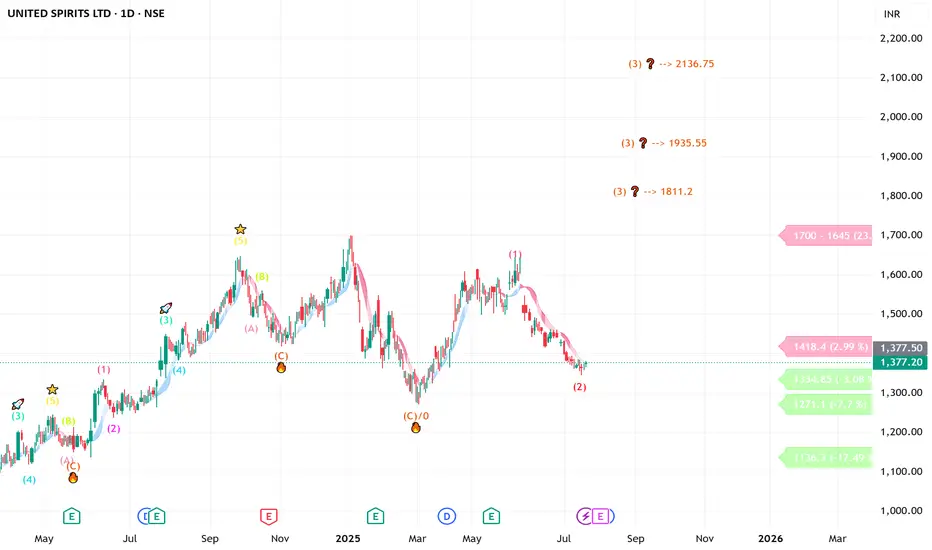
UNITED SPIRITS looking good ( short to long investment)Daily counts indicate Excellent bullish wave structure
Both appear to be optimistic and this stock invalidation number (S L) wave 2 low
target short / long term are already shared as per charts
we assume correction wave leg seems completed
Investing in declines is a smart move for short/ long-term players.
Buy in DIPS recommended
Long-term investors prepare for strong returns over the next two to five years.
one of best counter
Every graphic used to comprehend & LEARN & understand the theory of Elliot waves, Harmonic waves, Gann Theory, and Time theory
Every chart is for educational purposes.
We have no accountability for your profit or loss.
UNITDSPR trade ideas
UNITDSPR My Target : 1480
My Entry : Price Breaks the High of Red Candle Before Low.
My Stop Loss : Low of Red after Entry
Else God Knows

Amazing breakout on WEEKLY Timeframe - UNITDSPRCheckout an amazing breakout happened in the stock in Weekly timeframe, macroscopically seen in Daily timeframe. Having a great favor that the stock might be bullish expecting a staggering returns of minimum 25% TGT. IMPORTANT BREAKOUT LEVELS ARE ALWAYS RESPECTED!
NOTE for learners: Place the breakout levels as per the chart shared and track it yourself to get amazed!!
#No complicated chart patterns
#No big big indicators
#No Excel sheet or number magics
TRADE IDEA: WAIT FOR THE STOCK TO BREAKOUT IN WEEKLY TIMEFRAME ABOVE THIS LEVEL.
Checkout an amazing breakout happened in the stock in Weekly timeframe.
Breakouts happening in longer timeframe is way more powerful than the breakouts seen in Daily timeframe. You can blindly invest once the weekly candle closes above the breakout line and stay invested forever. Also these stocks breakouts are lifelong predictions, it means technically these breakouts happen giving more returns in the longer runs. Hence, even when the scrip makes a loss of 10% / 20% / 30% / 50%, the stock will regain and turn around. Once they again enter the same breakout level, they will flyyyyyyyyyyyy like a ROCKET if held in the portfolio in the longer run.
Time makes money, GREEDY & EGO will not make money.
Also, magically these breakouts tend to prove that the companies turn around and fundamentally becoming strong. Also the magic happens when more diversification is done in various sectors under various scripts with equal money invested in each N500 scripts.
The real deal is when to purchase and where to purchase the stock. That is where Breakout study comes into play.
LET'S PUMP IN SOME MONEY AND REVOLUTIONIZE THE NATION'S ECONOMY!

Inching towards ATH#UNITDSPR inching towards ATH, can see the volumes are increasing. Breaking ATH on cards !

United spirited ltd up trend forming United spirited ltd up trend forming @ 1659 on 01 jan 25 it can continue the trend as past trend

POV : UNITEDSPR : UNITED SPIRITS LTDPOV : UNITEDSPR : UNITED SPIRITS LTD
Looking for breakout of Head and Shoulder Pattern and Retest
For educational purposes only. This is not financial advice. Please consult a professional before making financial decisions.
#NiVYAMi

United Spirits Short Term Swing TradeUnited Spirits Short Term Swing Trade
T - 16%
Time frame - 2 weeks to 6 weeks

United Spirits Ltd | Breakout Opportunity Above Key Resistance United Spirits Ltd (1D Chart) is testing a crucial resistance zone around ₹1,563.30 . A breakout above this level could trigger a strong upward move, with a potential target near ₹1,800 .
Resistance : ₹1,563.30
Support : ₹1,516.80
Target : ₹1,800.30
Stop Loss : Below ₹1,516.80
If the breakout sustains, this trade could offer a favorable risk-reward ratio. Watch closely for price action confirmation.
#BreakoutTrading #StockAnalysis #UNITDSP #PriceAction

United Spirits: High Spirits?Inverted HnS breakout done, volumes are rising, the 1st target is ATH and above it, it may rise to 1685 quickly. It may do good in medium term once crosses and gives a weekly close above1690.

United Spirits Ltd. (NSE: MCDOWELL-N) - Technical AnalysisKey Observations:
1️⃣ Bullish RSI Divergence:
The RSI indicates a bullish divergence, suggesting potential reversal or upside momentum.
2️⃣ Breakout from Descending Channel:
After a period of consolidation within the descending channel, the stock has broken out, supported by improving momentum.
3️⃣ Volume Profile Support:
Strong accumulation zone observed between ₹1,440-₹1,490, indicating demand at these levels.
4️⃣ Fibonacci Levels:
Resistance levels are identified at ₹1,491, ₹1,541, ₹1,591, and ₹1,634 based on Fibonacci retracements.
5️⃣ Moving Averages:
The stock is trading above key short-term moving averages, reinforcing the positive trend.
Trading Strategy:
🚀 For Long Positions:
Entry Zone: ₹1,440–₹1,460 (if price sustains above breakout level).
Targets: ₹1,491, ₹1,541, ₹1,591.
S top-Loss: ₹1,430 (below support zone).
⚠️ Risk Management:
If the stock re-enters the descending channel, it could invalidate the bullish outlook. Monitor price action and volume closely.
Outlook:
With the RSI divergence, breakout confirmation, and strong support at ₹1,440, United Spirits Ltd. presents a promising bullish setup for short- to medium-term gains. Watch for sustained volume as the price approaches resistance levels.
💬 Your Thoughts?
What’s your take on this setup? Share your views below! 🚀

United Spirits Ltd view for Intraday 12th Nov #UNITDSPR United Spirits Ltd view for Intraday 12th Nov #UNITDSPR
Resistance 1490. Watching above 1492 for upside movement...
Support area 1460. Below 1460 ignoring upside momentum for intraday
Support 1460.Watching below 1455 for downside movement...
Resistance area 1490
Above 1490 ignoring downside move for intraday
Charts for Educational purposes only.
Please follow strict stop loss and risk reward if you follow the level.
Thanks,
V Trade Point

UNITDSPR Breakout, Long for IntradayUNITDSPR Breakout closing in 15 Min. chart, Rectangle/Flag & Pole pattern breakout.
Daily Trend is also upwards
Wait for the retracement then can go for long position.
Question : Why wait for retracement?
Ans : Already made 8 green candles, there is a high probability that a red candle can be formed only then we can see the intensity and exact seller price.
If sellers are strong then it can be a breakout fail or if buyers are strong then that red candle will be act like a small stoploss/better price place for Buyers.
Note: This is just an analysis wait for the price to confirm.
Disclaimer :
Always follow Risk to Reward, because this is the key to success in this business, no matter how much good a trade is looking, we never know the future.

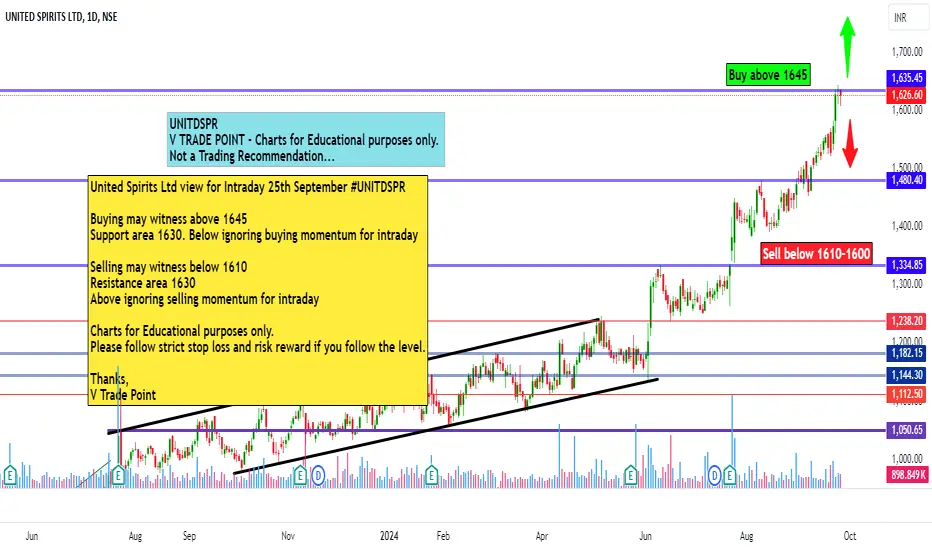
United Spirits Ltd view for Intraday 26th September #UNITDSPR United Spirits Ltd view for Intraday 26th September #UNITDSPR
Buying may witness above 1645
Support area 1625. Below ignoring buying momentum for intraday
Selling may witness below 1610
Resistance area 1625
Above ignoring selling momentum for intraday
Charts for Educational purposes only.
Please follow strict stop loss and risk reward if you follow the level.
Thanks,
V Trade Point
UNITED SPIRITS LTD S/R Support and Resistance Levels:
Support Levels: These are price points (green line/shade) where a downward trend may be halted due to a concentration of buying interest. Imagine them as a safety net where buyers step in, preventing further decline.
Resistance Levels: Conversely, resistance levels (red line/shade) are where upward trends might stall due to increased selling interest. They act like a ceiling where sellers come in to push prices down.
Breakouts:
Bullish Breakout: When the price moves above resistance, it often indicates strong buying interest and the potential for a continued uptrend. Traders may view this as a signal to buy or hold.
Bearish Breakout: When the price falls below support, it can signal strong selling interest and the potential for a continued downtrend. Traders might see this as a cue to sell or avoid buying.
20 EMA (Exponential Moving Average):
Above 20 EMA: If the stock price is above the 20 EMA, it suggests a potential uptrend or bullish momentum.
Below 20 EMA: If the stock price is below the 20 EMA, it indicates a potential downtrend or bearish momentum.
Trendline: A trendline is a straight line drawn on a chart to represent the general direction of a data point set.
Uptrend Line: Drawn by connecting the lows in an upward trend. Indicates that the price is moving higher over time. Acts as a support level, where prices tend to bounce upward.
Downtrend Line: Drawn by connecting the highs in a downward trend. Indicates that the price is moving lower over time. It acts as a resistance level, where prices tend to drop.
RSI: RSI readings greater than the 70 level are overbought territory, and RSI readings lower than the 30 level are considered oversold territory.
Combining RSI with Support and Resistance:
Support Level: This is a price level where a stock tends to find buying interest, preventing it from falling further. If RSI is showing an oversold condition (below 30) and the price is near or at a strong support level, it could be a good buy signal.
Resistance Level: This is a price level where a stock tends to find selling interest, preventing it from rising further. If RSI is showing an overbought condition (above 70) and the price is near or at a strong resistance level, it could be a signal to sell or short the asset.
Disclaimer:
I am not a SEBI registered. The information provided here is for learning purposes only and should not be interpreted as financial advice. Consider the broader market context and consult with a qualified financial advisor before making investment decisions.
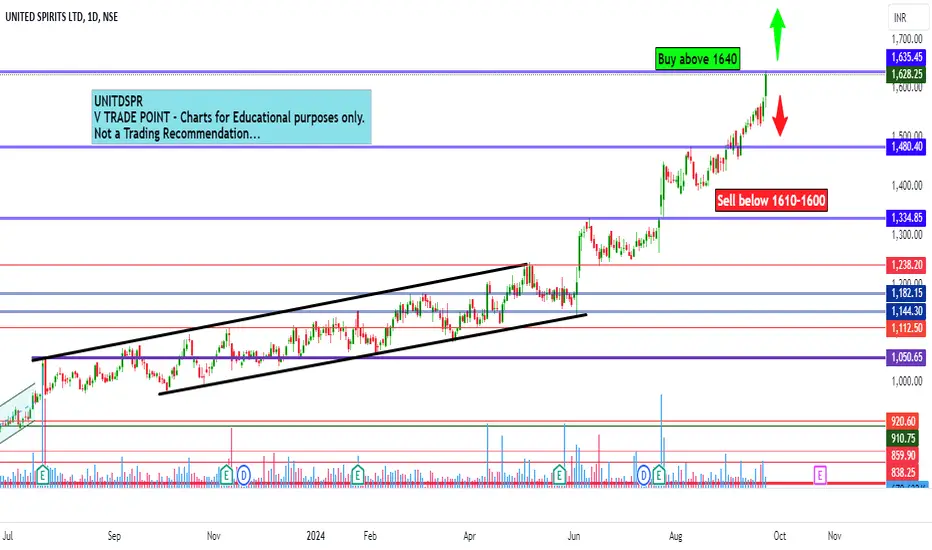
United Spirits Ltd view for Intraday 24th September #UNITDSPR United Spirits Ltd view for Intraday 24th September #UNITDSPR
Buying may witness above 1640
Support area 1610. Below ignoring buying momentum for intraday
Selling may witness below 1610
Resistance area 1640
Above ignoring selling momentum for intraday
Charts for Educational purposes only.
Please follow strict stop loss and risk reward if you follow the level.
Thanks,
V Trade Point
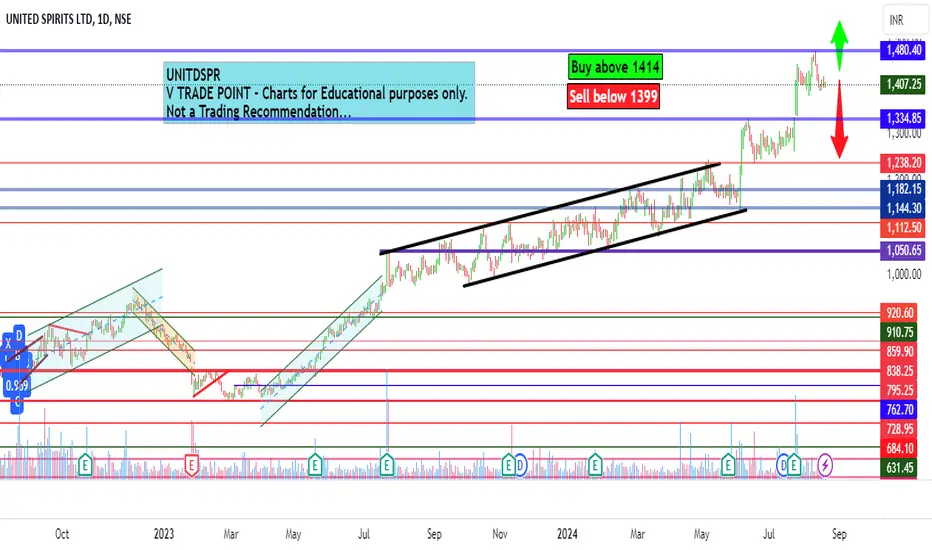
United Spirits Ltd intraday level for 21st Aug #UNITDSPR United Spirits Ltd intraday level for 21st Aug #UNITDSPR
Buying may witness above 1414
Support area 1399-1400. Below ignoring buying momentum for intraday
Selling may witness below 1399
Resistance area 1410-1414
Above ignoring selling momentum for intraday
Charts for Educational purposes only.
Please follow strict stop loss and risk reward if you follow the level.
Thanks,
V Trade Point
United Spirits has united all of his strength to go up!The stock has a strong resistance at ₹1461.30. Key support levels are at ₹1307.70 and ₹1288.08.
- The stock price has broken out from the resistance level of ₹1307.70 and is currently trading at ₹1332.00.
- There has been a significant increase in trading volume, indicating strong buying interest.
- The stock is trading above its 20-day and 50-day moving averages, indicating a bullish trend.
- Based on the height of the rectangle pattern formed, the next target for the stock could be around ₹1461.30.
So, overall it looks like United Spirits Ltd has shown a strong bullish breakout from its resistance level and is likely to continue its upward momentum towards the target price of ₹1461.30.
Disclaimer: This analysis is based on technical indicators and should not be considered as financial advice. Always perform your own research or consult with a financial advisor before making any investment decisions.

Go long - swing pickShows huge delivery %
Go long if 15m close crosses top line
Bottom line is sl, wait for day's candle to close below
Keep 1:1.5 RR.

UNITDSPR go LongUNITDSPR falling since 32 trading sessions. Finally found good support at Fibonacci level 0.786. Go long!

Bullish on United SpiritsThe downside might be limited in this stock. A break of the upper line could result in the continuation of the up move.
