UNOMINDA , 1W , Bullish The pattern is channel , it is ready to Breakout , Enter after only clear confirmation in weekly strong close then enter , follow proper position sizing and risk management
follow for more swing Ideas like this
UNOMINDA trade ideas
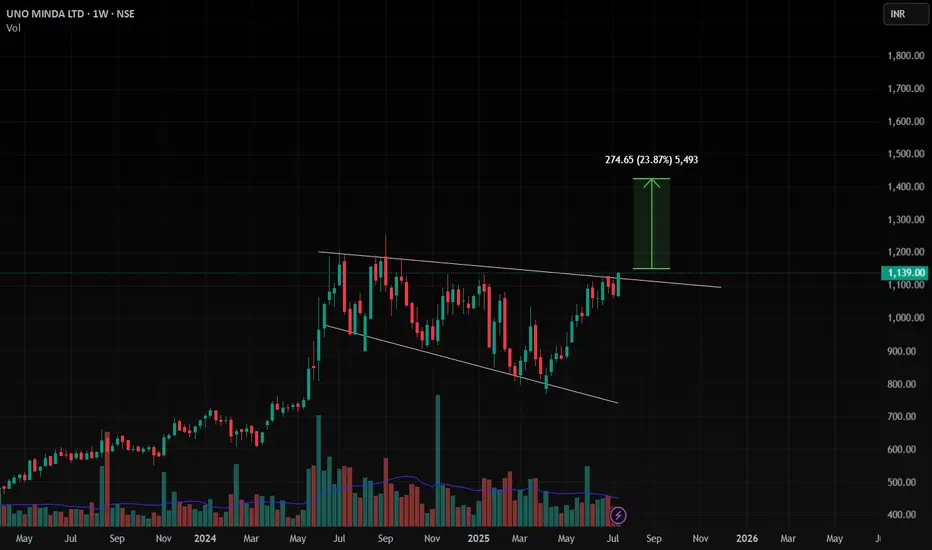
Technical Analysis – UNO MINDA LTD (June 27, 2025)UNO MINDA is showing strong bullish momentum after forming a base and reclaiming the 200 EMA. The breakout from the falling channel and consolidation near resistance suggest strength. As long as it sustains above ₹1020, accumulation in the 1100–1110 range is favorable for a move toward ₹1300+
Weekly Chart:-
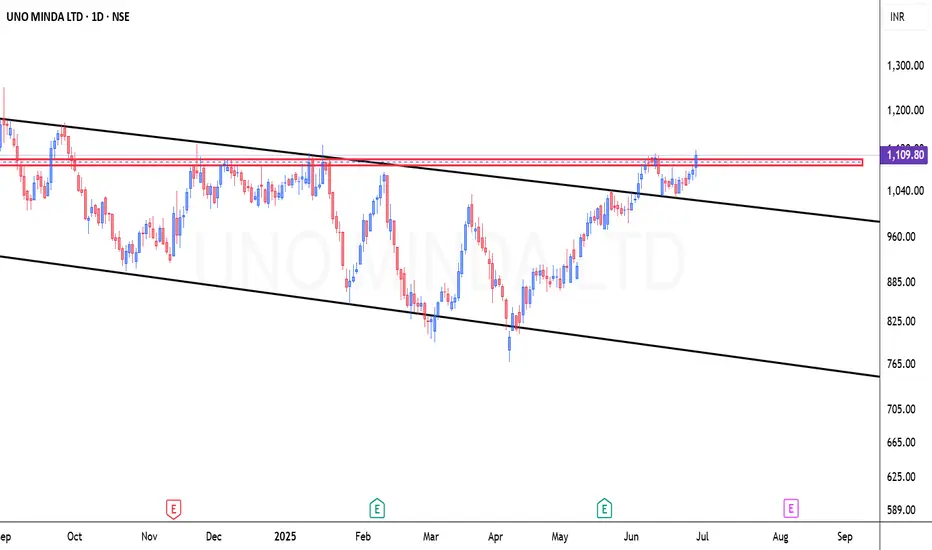
Daily Chart:-
The stock has:
Formed a strong base around ₹850–₹900.
Broken above the 200-day EMA with strength.
Recently made higher highs and higher lows, which is a bullish price structure.
Consolidated near a resistance zone (around ₹1100–₹1120) and is now trying to break above it.
Chart Pattern Insight:
The stock was earlier trading within a downward-sloping channel (black trendlines).
It has recently broken out of the upper boundary of this channel.
A horizontal resistance zone (highlighted in red) around ₹1110 is currently being tested.
If the price closes convincingly above ₹1120, it would confirm a bullish breakout.
UNOMINDA | Buy @LTP | SL below 960 | Target 1480Disclaimer:
This is not financial advice. Please do your own research or consult with a financial advisor before making any investment decisions. Investments in stocks can be risky and may result in loss of capital.

Uno Minda Ltd – Coiled for a Breakout🚗 Uno Minda Ltd – Coiled for a Breakout After 38% Correction!
📉 Stock Background & Current Structure:
Uno Minda Ltd, a key player in the automobile components sector, has corrected nearly 38% from its all-time high of ₹1,255. The recent low was recorded around ₹867, which is close to a key swing level.
What's interesting is that the stock recently:
Swiped the latest swing low, potentially triggering stop hunts and liquidity grabs.
Has been consolidating in a tight range (₹915–₹880) for the last 9 trading sessions.
This behavior typically signals absorption of selling pressure and potential preparation for an explosive move.
🧠 Why This Trade Setup?
A strong support base is being formed in the consolidation range.
Despite a lower-low formation on the higher timeframe, price failed to break down aggressively.
This indicates that smart money might be accumulating.
If the price breaks out of this consolidation range, it offers a great swing trade setup with a well-defined risk-to-reward profile.
🎯 Trade Plan:
Element Levels
Entry On breakout above ₹915
Stop-Loss ₹870 (just below swing low)
Target 1 ₹993
Target 2 (optional) ₹1,070
Target 3 (longer term) ₹1,150
We are currently focused on Target 1, and will assess further upside if momentum sustains.
🔍 Technical Perspective:
Consolidation zones often lead to strong directional moves.
Recent swing low swipe signals liquidity grab — a common sign before reversals.
A breakout will confirm short-term trend reversal on lower timeframes.
This is a classic "base + breakout" setup loved by both swing and positional traders.
🔔 What Led Me to Update This Analysis?
Significant price correction offering value
Repeated tests of support without breakdown
Range-bound movement suggests seller exhaustion
Structure aligns with high-probability breakout pattern
📌 Summary:
Stock: Uno Minda Ltd
Sector: Auto Parts / Manufacturing
Strategy: Breakout Swing Trade
Risk Level: Moderate (tight SL, defined setup)
📢 Don’t Miss Out!
✅ Follow me so you don’t miss the next breakout opportunity!
👍 If this helped you, drop a like and leave a comment with your view!
💬 Let’s chat in the comments. See you there! 🚀📊
🙏 Thanks for your continued support. Let’s grow together as traders!
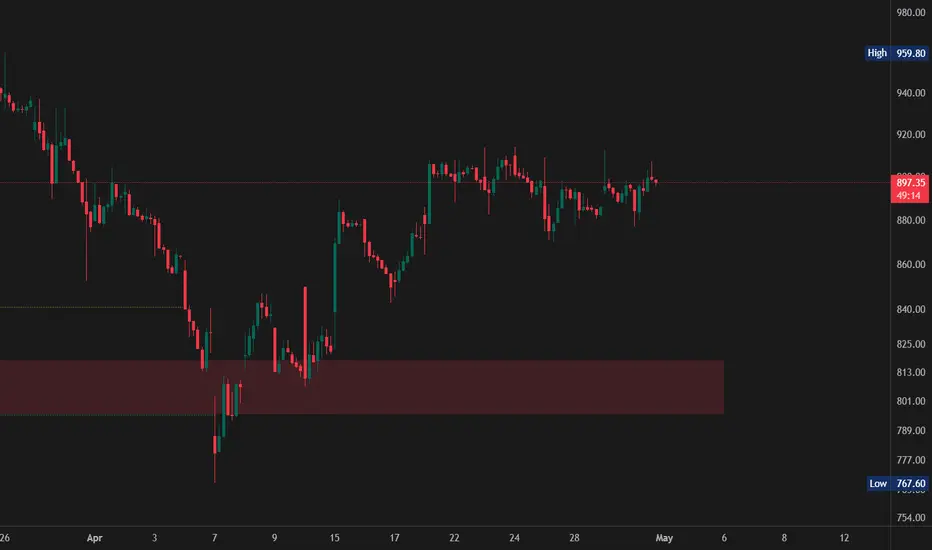
#UNOMINDA Supply Zone Discover key supply zones for UNOMINDA with detailed price action analysis. Ideal for identifying potential reversal points, resistance levels, and strategic entry/exit points. Perfect for traders focusing on demand and supply!

UNO Minda on previous pullback support Stock sideways in daily chart while still bullish over weekly chart.
Expected return from here around 50% for long term.

UNO MINDAUNO MINDA today makes a new fresh high and also it breaks the resistance zone of ATH. Can we go for Long from here or we should wait for some retracement ???

"UnoMinda" at the cusp of breakout! "UnoMinda" is a great counter to go Long on with high probability and great risk - reward ratio! The stock is about to breakout from a Cup Pattern. The price is at the cusp of breakout which is giving more confidence to enter the trade on Long Side.
#SniperTrade #Momentum #Options #CapitalMarkets #harshal95 #StockMarket

UNOMINDA inverse HNSUnominda has made small inverse head and shoulder with max SL of 1075 with target of 1425-1460 based on the pattern

August buy 10% club welcomeI thought not to post any stock for this month but after seeing this amazing break I would suggest buying 50% of your capability for 10%

Intraday scalpSolid signals on long scalp #UNOMINDA: Stock outperforming Vs Index. Strong Momentum, Strong trend .

UNO MINDA LTD S/RSupport and Resistance Levels: In technical analysis, support and resistance levels are significant price levels where buying or selling interest tends to be strong. They are identified based on previous price levels where the price has shown a tendency to reverse or find support.
Support levels are represented by the green line and green shade, indicating areas where buying interest may emerge to prevent further price decline.
Resistance levels are represented by the red line and red shade, indicating areas where selling pressure may arise to prevent further price increases. Traders often consider these levels as potential buying or selling opportunities.
Breakouts: Breakouts occur when the price convincingly moves above a resistance level (red shade) or below a support level (green shade). A bullish breakout above resistance suggests the potential for further price increases, while a bearish breakout below support suggests the potential for further price declines. Traders pay attention to these breakout signals as they may indicate the start of a new trend or significant price movement.
20 EMA: The yellow line denotes 20 EMA, to interpret the 20 EMA, you need to compare it with the prevailing stock price. If the stock price is below the 20 EMA, it signals a possible downtrend. But if the stock price is above the 20 EMA, it signals a possible uptrend.
Disclosure: I am not SEBI registered. The information provided here is for learning purposes only and should not be interpreted as financial advice. It is important to consult with a qualified financial advisor before making any investment decisions. Tweets neither advice nor endorsement.

Uno Minda LtdTargets given in chart - SL is closure below Trend line on DCB
Market Cap
₹ 36,469 Cr.
Current Price
₹ 636
High / Low
₹ 658 / 433
Stock P/E
53.2
Book Value
₹ 72.5
DividendYield
0.08 %
ROCE
19.4 %
ROE
17.2 %
Face Value
₹ 2.00
Promoter holding
70.0 %
EPS last year
₹ 11.4
EPS latest quarter
₹ 3.01
Debt
₹ 1,395 Cr.
Pledged percentage
0.00 %
Net CF
₹ -86.5 Cr.
Price to Cash Flow
45.7
Free Cash Flow
₹ -146 Cr.
Debt to equity
0.34
OPM last year
11.0 %
OPM 5Year
11.2 %
Reserves
₹ 4,041 Cr.
Price to book value
8.72
Int Coverage
13.0
PEG Ratio
2.92
Price to Sales
3.10
Market Cap to Sales
3.10
Qtr Profit Var
24.5 %

SWING IDEA - UNO MINDAUno Minda , a leading automotive components manufacturer, stands out as a compelling candidate for investors.
Reasons are listed below :
Multiple tests on the 600-630 levels followed by a breakout, now undergoing retesting, indicating a significant market shift.
Identification of a bullish "morning star" on the daily timeframe and a bullish "hammer" on the weekly timeframe, signaling potential upward momentum.
Strong support from the 50 EMA on the weekly and the 200 EMA on the daily timeframe, bolstering Uno Minda's price action.
Support from the golden Fibonacci zone reinforces the importance of current price levels, adding confidence to potential trades.
Consistent establishment of higher highs reflects a sustained bullish trend, aligning with swing trading strategies seeking upward movement.
A notable increase in trading volumes underscores growing investor interest and suggests the potential for sustained momentum.
Target - 720 // 765
StopLoss - weekly close below 604
DISCLAIMER -
Decisions to buy, sell, hold or trade in securities, commodities and other investments involve risk and are best made based on the advice of qualified financial professionals. Any trading in securities or other investments involves a risk of substantial losses. The practice of "Day Trading" involves particularly high risks and can cause you to lose substantial sums of money. Before undertaking any trading program, you should consult a qualified financial professional. Please consider carefully whether such trading is suitable for you in light of your financial condition and ability to bear financial risks. Under no circumstances shall we be liable for any loss or damage you or anyone else incurs as a result of any trading or investment activity that you or anyone else engages in based on any information or material you receive through TradingView or our services.
@visionary.growth.insights


Unominda ready for big moveUnominda gave a clear breakout and retest of resistance levels on monthly basis time frame. I have men fib extensions targets as well. For easy reference

UNOMINDAFinally the stock is moving in to higher territory. In August we expected the stock to move up . But that move failed. Now the stock is taken out the Price Rejection Zone with Volume support. Other key parameters like Relative Strength, Money Flow, Buying Pressure all supporting the move. The minor, medium and long term trends are all up. The stock looks good to go.

💥UNO Minda💥-Nice Breakout💥UNO Minda💥-Nice Breakout
Capital to be deployed- 20k
Investing Price-652-654
Breakout Price-652
Stoploss-564
Targets-843-1987
RT for max reach
#unominda #stockstowatch #StocksToBuy #StocksInFocus #stocks #StockMarket

READY FOR BREAKOUTUNOMINDA-The future stock of EV-ERA is ready for breakout.Keep the eyes on the stock for good long term investment.

Buy Uno Minda in range of 570-610Buy Uno Minda in range of 570-610.
long term holding only.
target 2024-25 -> 1800-2400

UNOMINDA - Breakout of previous ATH lvlLooking at Weekly chart on UNOMINDA, it has broken its previous ATH lvl today.
Past 2 days have shown good volumes and this weeks volume clearly shows a pop compared to the earlier ones.
Initiated long here with a STOP at 625, expecting 700 soon as long as STOP is not taken out


