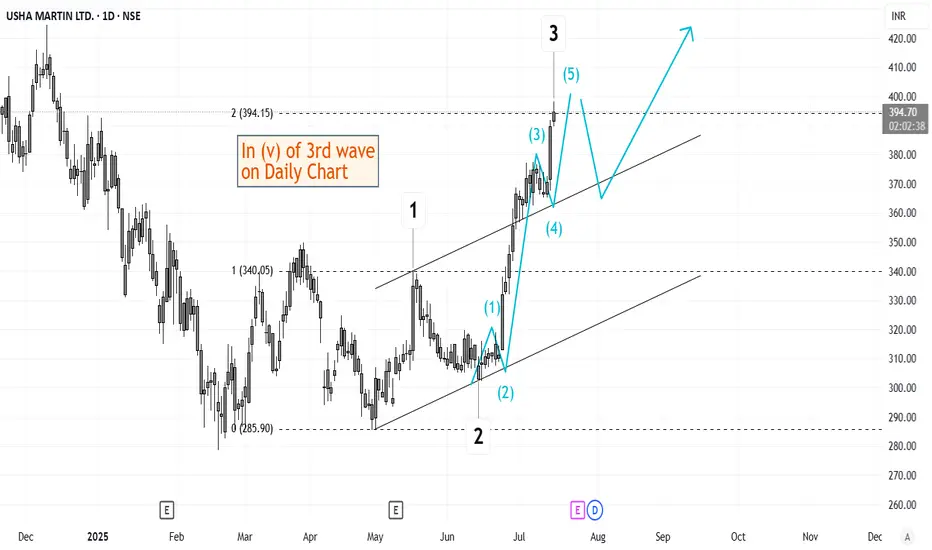
Elliott Wave Analysis of Usha Martin USHAMARTThe script is currently in (v) of 3rd wave on daily time frame. This should be followed by a short retracement and then a 5th wave up. Will keep updating this chart as it progresses.
Next report date
—
Report period
—
EPS estimate
—
Revenue estimate
—
13.35 INR
4.07 B INR
34.61 B INR
171.58 M
About USHA MARTIN LTD.
Sector
Industry
CEO
Rajeev Jhawar
Website
Headquarters
Kolkata
Founded
1960
ISIN
INE228A01035
FIGI
BBG000D1LYY7
Usha Martin Ltd. engages in the manufacture of wire ropes and steel. It operates through Wire & Wire Ropes and Others segments. The Wire & Wire Ropes segment consist of steel wires, strands, wire ropes, cord, bright bar, related accessories including wire drawing and allied machines. The Others segment includes manufacture and selling of wire drawing and allied machines. The company was founded by Basant Kumar Jhawar and Brij Kishore Jhawar in 1960 and is headquartered in Kolkata, India.
Related stocks
“USHAMART | V-Shaped Recovery with RSI Breakout | Bullish Setup”
🛠 Chart Pattern: The chart indicates a V-shaped recovery from the recent lows around ₹275 levels, forming a rounded bottom structure.
📊 Breakout Zone: Price has broken above short-term resistance near ₹315–₹320 zone on strong bullish candles.
📈 Momentum Indicator: RSI has broken above 60, current

Usha Martin Ltd forming a good swing long patternUsha Martin Ltd forming a good swing long pattern. Price above R1 pivot.
🔎 Important Note: During market crashes or prolonged corrections, strong stocks tend to correct later and with a smaller percentage decline.
⚠️ This is NOT a buy recommendation. Please consult your financial adviser be

USHA MARTIN LTD S/RSupport and Resistance Levels:
Support Levels: These are price points (green line/shade) where a downward trend may be halted due to a concentration of buying interest. Imagine them as a safety net where buyers step in, preventing further decline.
Resistance Levels: Conversely, resistance levels (re

Volume Breakout - Swing TradeDisclaimer: I am not a Sebi registered adviser.
This Idea is publish purely for educational purpose only before investing in any stocks please take advise from your financial adviser.
Volume Breakout. Stock has give Breakout with Volume. Keep in watch list. Buy above the high. Suitable for Swing Tr

Ascending triangle patternGood volume build up in daily and weekly timeframe.
Ascending triangle breakout with good volume.
Fundamentals are OK.
DII stakes are up.
NOTE: I do my analysis, do yours before trade.
Eat🍜 Sleep😴 TradingView📈 Repeat 🔁

Swing trade - USHAMARTINCMP - 332
Green line - Support
Red line - Resistance
Keep trailing (With window of 5%) if going with large quantity.
Exit if falls below 312

USHAMART TO THE MOON### Usha Martin Limited: CANSLIM Analysis
Usha Martin Limited is a leading global manufacturer of wire ropes. The company operates in various segments, including steel and wire ropes, and serves industries such as oil & gas, mining, elevator, cranes, and infrastructure. Applying the CANSLIM method

#Ushamart 33% upside in Few months Based on the chart for Usha Martin Ltd (USHAMART on NSE) you provided, here is a trading recommendation:
### Trading Recommendation:
- **Entry:** If the stock price stays above the current level around ₹371.25, as this indicates sustained buyer interest.
- **Target:** ₹476.10 as marked on your char

USHAMART Good Breakout With High Quality Volume USHAMART Good Breakout With High Quality Volume
Buy Above 355
Stoploss Near 280
Target Near 450
Holding Time 2-3 Year
Disclosure : I am not SEBI registered.The information provided here is for education purposes only.I will not be responsible for any of your profit/loss with this channel

See all ideas
Summarizing what the indicators are suggesting.
Neutral
SellBuy
Strong sellStrong buy
Strong sellSellNeutralBuyStrong buy
Neutral
SellBuy
Strong sellStrong buy
Strong sellSellNeutralBuyStrong buy
Neutral
SellBuy
Strong sellStrong buy
Strong sellSellNeutralBuyStrong buy
An aggregate view of professional's ratings.
Neutral
SellBuy
Strong sellStrong buy
Strong sellSellNeutralBuyStrong buy
Neutral
SellBuy
Strong sellStrong buy
Strong sellSellNeutralBuyStrong buy
Neutral
SellBuy
Strong sellStrong buy
Strong sellSellNeutralBuyStrong buy
Displays a symbol's price movements over previous years to identify recurring trends.
Frequently Asked Questions
The current price of USHAMART is 368.15 INR — it has decreased by −2.52% in the past 24 hours. Watch USHA MARTIN LTD. stock price performance more closely on the chart.
Depending on the exchange, the stock ticker may vary. For instance, on NSE exchange USHA MARTIN LTD. stocks are traded under the ticker USHAMART.
USHAMART stock has fallen by −1.19% compared to the previous week, the month change is a 0.96% rise, over the last year USHA MARTIN LTD. has showed a −3.05% decrease.
We've gathered analysts' opinions on USHA MARTIN LTD. future price: according to them, USHAMART price has a max estimate of 541.00 INR and a min estimate of 541.00 INR. Watch USHAMART chart and read a more detailed USHA MARTIN LTD. stock forecast: see what analysts think of USHA MARTIN LTD. and suggest that you do with its stocks.
USHAMART reached its all-time high on Oct 15, 2024 with the price of 451.00 INR, and its all-time low was 6.70 INR and was reached on Feb 29, 2016. View more price dynamics on USHAMART chart.
See other stocks reaching their highest and lowest prices.
See other stocks reaching their highest and lowest prices.
USHAMART stock is 4.05% volatile and has beta coefficient of 1.37. Track USHA MARTIN LTD. stock price on the chart and check out the list of the most volatile stocks — is USHA MARTIN LTD. there?
Today USHA MARTIN LTD. has the market capitalization of 112.13 B, it has increased by 4.04% over the last week.
Yes, you can track USHA MARTIN LTD. financials in yearly and quarterly reports right on TradingView.
USHA MARTIN LTD. is going to release the next earnings report on Aug 4, 2025. Keep track of upcoming events with our Earnings Calendar.
USHA MARTIN LTD. revenue for the last quarter amounts to 8.96 B INR, despite the estimated figure of 8.73 B INR. In the next quarter, revenue is expected to reach 8.85 B INR.
USHAMART net income for the last quarter is 1.01 B INR, while the quarter before that showed 925.70 M INR of net income which accounts for 9.10% change. Track more USHA MARTIN LTD. financial stats to get the full picture.
Yes, USHAMART dividends are paid annually. The last dividend per share was 3.00 INR. As of today, Dividend Yield (TTM)% is 0.82%. Tracking USHA MARTIN LTD. dividends might help you take more informed decisions.
USHA MARTIN LTD. dividend yield was 0.89% in 2024, and payout ratio reached 22.44%. The year before the numbers were 0.86% and 19.77% correspondingly. See high-dividend stocks and find more opportunities for your portfolio.
As of Aug 2, 2025, the company has 5 K employees. See our rating of the largest employees — is USHA MARTIN LTD. on this list?
EBITDA measures a company's operating performance, its growth signifies an improvement in the efficiency of a company. USHA MARTIN LTD. EBITDA is 5.97 B INR, and current EBITDA margin is 16.97%. See more stats in USHA MARTIN LTD. financial statements.
Like other stocks, USHAMART shares are traded on stock exchanges, e.g. Nasdaq, Nyse, Euronext, and the easiest way to buy them is through an online stock broker. To do this, you need to open an account and follow a broker's procedures, then start trading. You can trade USHA MARTIN LTD. stock right from TradingView charts — choose your broker and connect to your account.
Investing in stocks requires a comprehensive research: you should carefully study all the available data, e.g. company's financials, related news, and its technical analysis. So USHA MARTIN LTD. technincal analysis shows the neutral today, and its 1 week rating is buy. Since market conditions are prone to changes, it's worth looking a bit further into the future — according to the 1 month rating USHA MARTIN LTD. stock shows the buy signal. See more of USHA MARTIN LTD. technicals for a more comprehensive analysis.
If you're still not sure, try looking for inspiration in our curated watchlists.
If you're still not sure, try looking for inspiration in our curated watchlists.