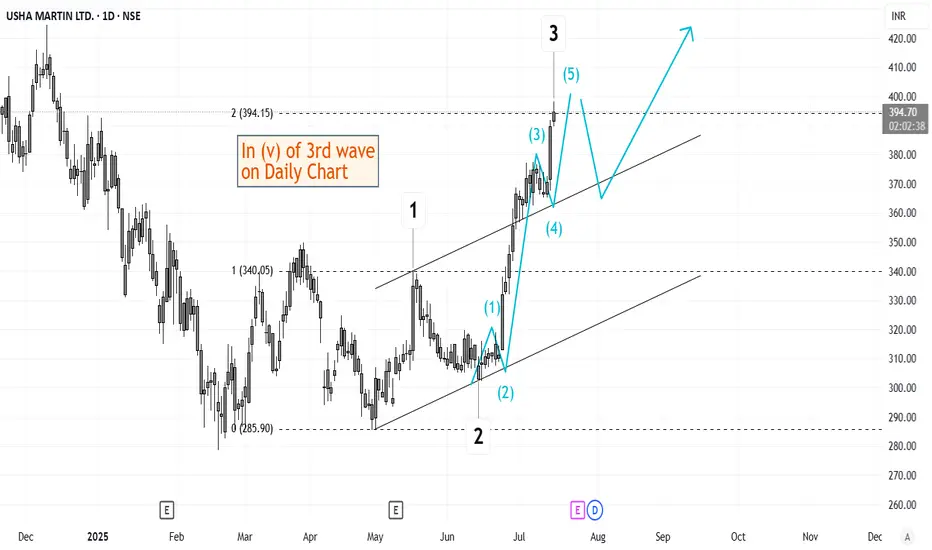
Elliott Wave Analysis of Usha Martin USHAMARTThe script is currently in (v) of 3rd wave on daily time frame. This should be followed by a short retracement and then a 5th wave up. Will keep updating this chart as it progresses.
USHAMART trade ideas
“USHAMART | V-Shaped Recovery with RSI Breakout | Bullish Setup”
🛠 Chart Pattern: The chart indicates a V-shaped recovery from the recent lows around ₹275 levels, forming a rounded bottom structure.
📊 Breakout Zone: Price has broken above short-term resistance near ₹315–₹320 zone on strong bullish candles.
📈 Momentum Indicator: RSI has broken above 60, currently around ~61.13, suggesting increasing bullish momentum.
🔥 Volume: Notable spike observed during breakout, confirming buying interest.
💡 Potential Setup:
• Entry on Breakout: ₹325+ (already in progress)
• Targets: ₹345 / ₹365 / ₹395
• Stoploss: Closing below ₹310 or below breakout candle low
🧠 Positional/Swing Trade Setup: Traders can consider entry on dips near ₹315–₹320 or on sustained move above ₹330 with volume confirmation.
⸻
⚠️ Disclaimer:
This chart analysis is provided strictly for educational and informational purposes only.
It does not constitute investment advice or a solicitation to buy/sell any securities.
Always consult a SEBI-registered financial advisor before making trading decisions.
Finsight Research | #TradeWithKnowledge

Usha Martin Ltd forming a good swing long patternUsha Martin Ltd forming a good swing long pattern. Price above R1 pivot.
🔎 Important Note: During market crashes or prolonged corrections, strong stocks tend to correct later and with a smaller percentage decline.
⚠️ This is NOT a buy recommendation. Please consult your financial adviser before making any investment decisions.

USHA MARTIN LTD S/RSupport and Resistance Levels:
Support Levels: These are price points (green line/shade) where a downward trend may be halted due to a concentration of buying interest. Imagine them as a safety net where buyers step in, preventing further decline.
Resistance Levels: Conversely, resistance levels (red line/shade) are where upward trends might stall due to increased selling interest. They act like a ceiling where sellers come in to push prices down.
Breakouts:
Bullish Breakout: When the price moves above resistance, it often indicates strong buying interest and the potential for a continued uptrend. Traders may view this as a signal to buy or hold.
Bearish Breakout: When the price falls below support, it can signal strong selling interest and the potential for a continued downtrend. Traders might see this as a cue to sell or avoid buying.
20 EMA (Exponential Moving Average):
Above 20 EMA(50 EMA): If the stock price is above the 20 EMA, it suggests a potential uptrend or bullish momentum.
Below 20 EMA: If the stock price is below the 20 EMA, it indicates a potential downtrend or bearish momentum.
Trendline: A trendline is a straight line drawn on a chart to represent the general direction of a data point set.
Uptrend Line: Drawn by connecting the lows in an upward trend. Indicates that the price is moving higher over time. Acts as a support level, where prices tend to bounce upward.
Downtrend Line: Drawn by connecting the highs in a downward trend. Indicates that the price is moving lower over time. It acts as a resistance level, where prices tend to drop.
RSI: RSI readings greater than the 70 level are overbought territory, and RSI readings lower than the 30 level are considered oversold territory.
Combining RSI with Support and Resistance:
Support Level: This is a price level where a stock tends to find buying interest, preventing it from falling further. If RSI is showing an oversold condition (below 30) and the price is near or at a strong support level, it could be a good buy signal.
Resistance Level: This is a price level where a stock tends to find selling interest, preventing it from rising further. If RSI is showing an overbought condition (above 70) and the price is near or at a strong resistance level, it could be a signal to sell or short the asset.
Disclaimer:
I am not a SEBI registered. The information provided here is for learning purposes only and should not be interpreted as financial advice. Consider the broader market context and consult with a qualified financial advisor before making investment decisions.

Volume Breakout - Swing TradeDisclaimer: I am not a Sebi registered adviser.
This Idea is publish purely for educational purpose only before investing in any stocks please take advise from your financial adviser.
Volume Breakout. Stock has give Breakout with Volume. Keep in watch list. Buy above the high. Suitable for Swing Trade. Stop loss & Target Shown on Chart. Exit With in 5 to 10 Days
Be Discipline because discipline is the Key to Success in the STOCK Market.
Trade What you see not what you Think

Ascending triangle patternGood volume build up in daily and weekly timeframe.
Ascending triangle breakout with good volume.
Fundamentals are OK.
DII stakes are up.
NOTE: I do my analysis, do yours before trade.
Eat🍜 Sleep😴 TradingView📈 Repeat 🔁

Swing trade - USHAMARTINCMP - 332
Green line - Support
Red line - Resistance
Keep trailing (With window of 5%) if going with large quantity.
Exit if falls below 312

USHAMART TO THE MOON### Usha Martin Limited: CANSLIM Analysis
Usha Martin Limited is a leading global manufacturer of wire ropes. The company operates in various segments, including steel and wire ropes, and serves industries such as oil & gas, mining, elevator, cranes, and infrastructure. Applying the CANSLIM method to Usha Martin involves a detailed look at its recent performance, industry position, and growth potential.
#### C - Current Quarterly Earnings Per Share (EPS)
For the latest quarter, Usha Martin has shown significant improvement in its EPS. According to the latest financial reports:
- **EPS Growth**: The company reported an EPS growth of 15% year-over-year, driven by higher sales and operational efficiency. This consistent growth is a positive indicator, aligning with the CANSLIM requirement for strong recent earnings performance.
#### A - Annual Earnings Growth
Examining the annual earnings growth:
- **Annual EPS Growth**: Over the past three years, Usha Martin has achieved an annual EPS growth rate of around 12%. This steady increase indicates the company’s ability to grow earnings annually, meeting the CANSLIM criterion for consistent and strong annual earnings growth.
#### N - New Products, Services, Management, or Market Conditions
Usha Martin has introduced several innovations and improvements:
- **New Products**: The company has expanded its product portfolio, especially in specialized wire ropes catering to niche markets.
- **Market Expansion**: Usha Martin is focusing on expanding its footprint in international markets, particularly in Europe and North America, which could drive future growth.
- **Management Initiatives**: The company has undergone management restructuring to enhance operational efficiency and strategic direction.
#### S - Supply and Demand
- **Stock Performance**: Usha Martin’s stock has shown increased trading volumes and a positive price trend, indicating strong demand from investors. The company’s market capitalization has also been rising, reflecting growing investor confidence.
#### L - Leader or Laggard?
- **Industry Position**: Usha Martin is one of the leading manufacturers in the wire rope industry, holding a significant market share. Compared to its peers, the company demonstrates strong financial health and operational efficiency, positioning it as an industry leader.
#### I - Institutional Sponsorship
- **Institutional Investors**: There has been a notable increase in institutional ownership, with several mutual funds and institutional investors adding Usha Martin to their portfolios. This growing institutional interest is a positive sign, as it suggests confidence in the company’s long-term prospects.
#### M - Market Direction
- **Market Conditions**: The overall market conditions are favorable, with the manufacturing sector experiencing a rebound post-pandemic. Usha Martin is well-positioned to benefit from the increasing demand in its core industries, supported by global economic recovery and infrastructure development initiatives.
### Summary
Usha Martin Limited aligns well with the CANSLIM criteria:
- **C**: Strong quarterly EPS growth of 15%.
- **A**: Consistent annual EPS growth of 12%.
- **N**: Introduction of new products, market expansion, and management initiatives.
- **S**: Increased trading volumes and positive stock performance.
- **L**: Leading market position in the wire rope industry.
- **I**: Growing institutional sponsorship.
- **M**: Favorable market conditions.
These factors collectively suggest that Usha Martin Limited is a promising candidate for growth-oriented investors, demonstrating strong financial performance, industry leadership, and favorable market dynamics.

#Ushamart 33% upside in Few months Based on the chart for Usha Martin Ltd (USHAMART on NSE) you provided, here is a trading recommendation:
### Trading Recommendation:
- **Entry:** If the stock price stays above the current level around ₹371.25, as this indicates sustained buyer interest.
- **Target:** ₹476.10 as marked on your chart. This target is based on the resistance level you've indicated, suggesting a significant upside potential.
- **Stop Loss:** ₹343.20, placed just below recent lows to protect against downward movement.
### Trading Strategy:
- **Observation:** The stock has shown a strong upward movement and recently breached a key resistance level.
- **Action:** Monitor for stable or increasing prices above ₹371.25 before entering to confirm support is holding. This reduces the risk of a false breakout.
- **Profit Targets:** The profit target at ₹476.10 allows capturing substantial growth while still being realistic based on past price behavior.
- **Risk Management:** Setting a stop loss at ₹343.20 ensures that potential losses are capped and investments are protected if the trend reverses unexpectedly.
### Additional Considerations:
- **Volume and Momentum:** Confirm that the breakout is supported by increased trading volume and positive momentum indicators.
Here's an update on Usha Martin Ltd, including recent news and fundamental details:
### Recent News
Usha Martin Ltd has been actively engaged in expanding its business. The company, known for its manufacturing of wire ropes, has recently been focused on enhancing its market position and leveraging technology for better operational efficiency.
### Fundamental Overview
Usha Martin has shown a robust financial performance with significant growth in its revenue and profits. The company's focus on cost efficiency and expanding its product range has helped in maintaining a healthy profit margin. Additionally, the company's shareholding pattern reflects a stable investment by promoters and an increase in holdings by foreign institutional investors, indicating growing investor confidence.
For a more detailed financial breakdown, including performance insights and the latest quarterly results,

USHAMART Good Breakout With High Quality Volume USHAMART Good Breakout With High Quality Volume
Buy Above 355
Stoploss Near 280
Target Near 450
Holding Time 2-3 Year
Disclosure : I am not SEBI registered.The information provided here is for education purposes only.I will not be responsible for any of your profit/loss with this channel suggestions.Consult your financial advisor before taking any decisions.

Usha Martin Looking good as the weekly candle is almost nearing Gann levels @ 361 which should be a safe entry
Overall a good structure and seems like a next leg of rally would start soon above 361

Such A beautiful ChartFollowing 200 Sma Beautifully Should look this script in every Down move when it touches its magnet.
Gratify if you appreciate the practice then you can like it, share it and
If you want me to investigate any chart for you then would cherish doing that for you.
Thank you for your time and support.
Stay safe.

Range BreakoutPlease look into the chart for a detailed understanding.
Consider these for short-term & swing trades with 2% profit.
For BTST trades consider booking
target for 1% - 2%
For long-term trades look out for resistance drawn above closing.
Please consider these ideas for educational purpose

Watch USHAMARTINLook over the chart, and enter if the resistance zone breaks (Blue channel).
Make positions in tranches.
Fundamental investors may buy in support (Green zone).

USHA MARTlOOKS good for upmove
Huge volume seen at downside
Take entry at given level
Only for educational purpose.


All time high in USHA **IT IS A LONGTERM IDEA**
Follow below FOUR rules:
1)Book whole profit at the target price if you want.
2)Follow strict stoploss.
3)Use supertrend indicator as trailing stoploss if you want to ride the momentum and sell whole quantity once it hits the supertrend.
4)Wait as long as it hits the target price.(consolidation is more strong).
CHART IS SELF EXPLANATORY

Classic Chart Pattern.symmetrical Triangle, wait for close above or below breakout line, the take take trade in the side of breakout.


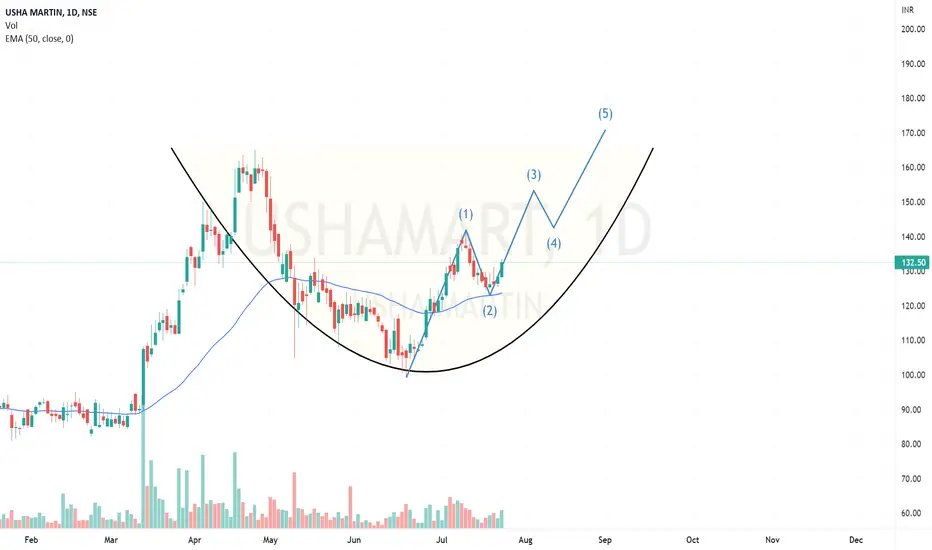
CUP & HANDLE - USHA MARTIN LTDCUP & HANDLE breakout above 140 - USHAMART
RSI is around 66
crossover on MACD
One can take as swing trade
Target - 150
Stoploss - 127

USHA MARTIN USHA MARTIN - Wolf (elliot) wave
Confluence of wave 1 & wave 4 indicates a strong resistance at 143 levels.
So 143 remains our short term target.
NOTE - Wave length calculated on the basis of Fibonacci.