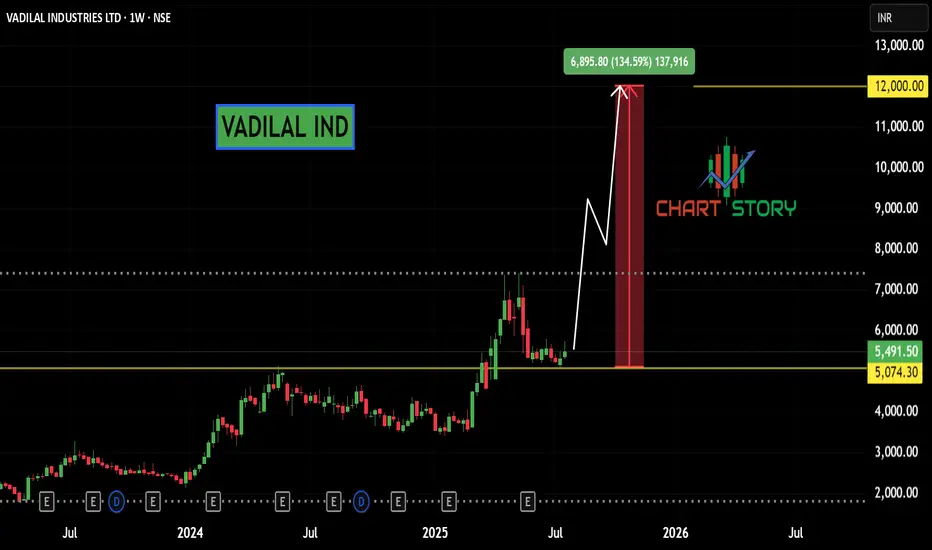
VADILAL IND - BUYNSE:VADILALIND Weekly parabolic formation may continue fast and short term momentum .
VADILALIND trade ideas
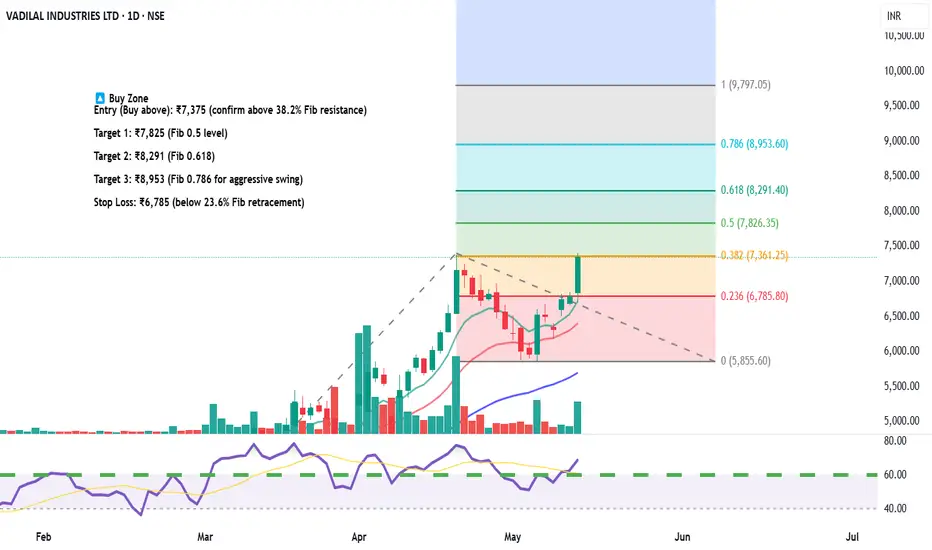
Vadilal Industries – Equity Trade Setup & Research View🟢 Long Trade Setup (Bullish Reversal Play)
Current Price: ₹7,346.50
Fibonacci Level Tested: 38.2% at ₹7,361 — a crucial breakout level
Trendline Breakout: Price has broken above falling trendline with volume confirmation
RSI: Near 60 – bullish momentum building
🔼 Buy Zone
Entry (Buy above): ₹7,375 (confirm above 38.2% Fib resistance)
Target 1: ₹7,825 (Fib 0.5 level)
Target 2: ₹8,291 (Fib 0.618)
Target 3: ₹8,953 (Fib 0.786 for aggressive swing)
Stop Loss: ₹6,785 (below 23.6% Fib retracement)
🔻 Short Trade Setup (if rejection happens)
Sell Below: ₹7,200
Target: ₹6,785
Stoploss: ₹7,375
📅 Timeframe: Daily (1D)
📊 Risk/Reward Ratio: 1:2.5+
🔁 Valid for: Next 2–4 weeks
For Education Purposes Only

vadilaloverperforming sector and benchmark index in last two months, pe is 24/53, peg is below.71 , undervalued share

VADILAL - onwards and upwardsIt has clearly broken out of falling channel into a fifth wave. Possible targets marked on the chart.
Note: This is not a buy/sell Recommendation.


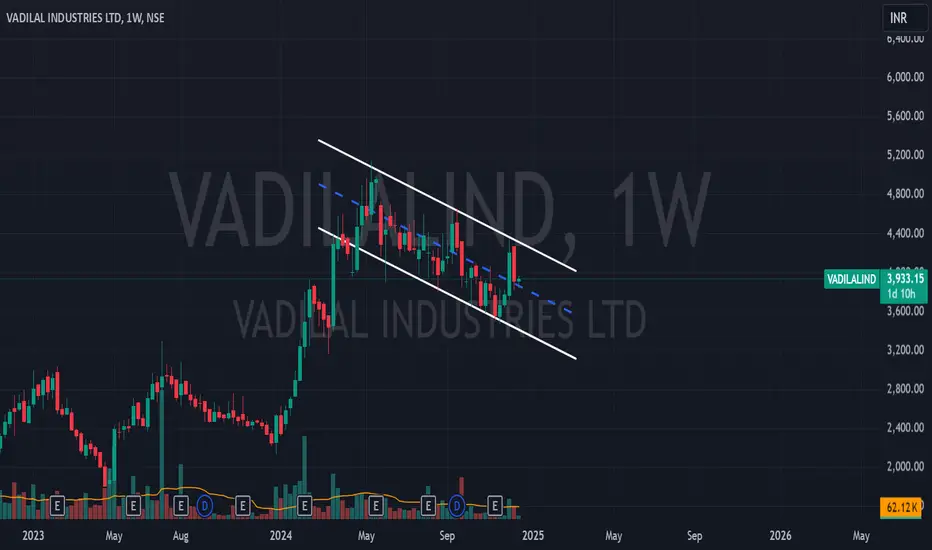
VADILALIND 1WVadilal Industries is exhibiting a bullish flag pattern on the weekly timeframe, currently trading near the resistance zone around 3933. A confirmed breakout above this level, supported by strong volume, could potentially trigger a significant upward rally. The projected target, based on the flagpole's height, points toward the 7000 level, aligning with key Fibonacci extension zones. Traders should monitor price action closely for breakout confirmation and sustained momentum.
I'm not a SEBI-registered analyst. All posts and levels shared are just for educational purposes. I'm not responsible for any losses or profits. No claims, all rights reserved
The 🍨 has frozen enough; now the next move is expected Key Levels:
Support: 2700
Resistance: 3299
Ideas:
Significance of the # JeddahPattern :
NSE:VADILALIND
1. **Unique Pattern:** The #JeddahPattern is a distinctive chart pattern in financial trading analysis, named after the city of Jeddah (the Entrance of Holy Mecca), Saudi Arabia.
2. **Trend Reversal Indicator:** Similar to the Inverted Triangle Pattern, the #JeddahPattern also serves as a potential trend reversal indicator. It can signal an impending shift in market sentiment, whether from bullish to bearish or vice versa.
3. **Recognition Ease:** Traders find it visually appealing and easy to identify on price charts due to its specific formation, making it a popular choice for technical analysis.
4. **Universal Applicability:** The #JeddahPattern is not restricted to any particular market or asset class, and traders can spot it across various financial instruments, including stocks, forex, commodities, and more.
5. **Confirmation with Volume:** To increase its reliability, traders often look for a surge in trading volume when the #JeddahPattern is forming. Heightened volume can reinforce the potential trend reversal signal.
6. **Timeframe Versatility:** The pattern's appearance is observable on different timeframes, accommodating traders with varying investment horizons.
7. **Risk Management:** When traders identify the #JeddahPattern, they can use it to adjust their risk management strategies. Placing stop-loss orders above or below the pattern's breakout point helps manage potential losses.
8. **Holistic Approach:** As with any technical analysis tool, traders often combine the #JeddahPattern with other indicators like moving averages, RSI, or MACD for a comprehensive analysis and validation of signals.
Remember, while the #JeddahPattern can be a valuable tool, it should not be the sole basis for trading decisions. Pair it with other analytical methods and consider broader market conditions to make well-informed choices. Happy trading! 📈

Vadilal Industries The daily candle has shown a bullish breakout with a gap up and significant trading volume. Additionally, both the RSI and MACD indicators are indicating positive momentum, and there is an increase in trading volume.

vadilal is strong since last 3 monthBuy vadilal with 10% stoploss.
target 3600.
stock was strong throughout the last a quarter

VADILALVadilal Breakout With Good Volume, A Nice Cup And Handle Patter. Keep Sl As Swing Low On A Closing Basis.

VADILAL INDUSTRIES NSE BULLISH VIEW ABOVE 2100 CMP 2153VADILAL INDUSTRIES VADILALIND NSE is bullish if 2100 holds. new Lifetime High. Fresh Breakout. Positive Trend.
Disclaimer: Educational purpose only. Not Buy/Sell Reco. Not Sebi Registered.

VADILAL INDUSTRYI am bullish in this stock
It give brealout in 2 h chart which also indicate us bullish \
Moving average also bullish


What Contributed Vadilal for 50% Move in 45 Days ?Worried that Market is Falling Since Budget?
Then how our research pick Vaidlal Industries got 50% move in 45 Days?
This is what a true Research will do and pay-off the best admist all odds.
Believe in Research and Analysis.

Go longGo for long, if close above trend line.
Disc: Study Purpose
Telegram id: T.me/earn50kto50lakhsin5years_1

Vadilal Looking good on charts if it corsses 600 !stock fundamentally strong, Not moved much, if crosses 600 can shoot up !.
