VAIBHAVGBL is trading in the demand zone.The technical analysis is only for educational purpose. Please consult with your financial advisor before investing.
VAIBHAVGBL trade ideas

Vaibhav Global: Trying to catch bottomStock is in support area. Recently trying to make higher high. With current level, your SL is small.
Why not risk some and try what happens.
If stock hits SL, then exit. Otherwise it can be good experiment.
Reason: There is high volume whenever stock has hit support area. Obviously not selling as stock moved up only from there. We can say that is pretty good chance bottom might have formed.
NOT an high conviction trade. Might take a lot of time to give a big move. Still in accumalation phase.

VAIBHAVGBL Daily timeframe analysis for long term
NSE:VAIBHAVGBL is consolidating in range.
Above 327 can go long with SL 316
Major targets are highlighted in blue lines.

Vaibhav Global Limited could see impulsive Move upside.Prices here are trading at discounted level @ demand zones make sure to buy at lower time frames to increase risk to reward..


Double Bottom Breakout - VAIBHAVGBL📊 Script: VAIBHAVGBL
📊 Sector: Diamond, Gems and Jewellery
📊 Industry: Diamond Cutting / Jewellery
Key highlights: 💡⚡
📈 Script is trading at upper band of BB and giving breakout of it .
📈 Script is giving Double Bottom Breakout we may see some good rally.
📈 Already crossover in MACD.
📈 Double Moving Averages are giving crossover.
📈 Script may give some profit booking initially because today stock was up by almost 7.50%.
📈 Right now RSI is around 58.
📈 One can go for Swing Trade.
⏱️ C.M.P 📑💰- 407
🟢 Target 🎯🏆 - 447
⚠️ Stoploss ☠️🚫 - 389
⚠️ Important: Always maintain your Risk & Reward Ratio.
✅Like and follow to never miss a new idea!✅
Disclaimer: I am not SEBI Registered Advisor. My posts are purely for training and educational purposes.
Eat🍜 Sleep😴 TradingView📈 Repeat 🔁

Short term buyStock has formed a bull flag patters with clear rejections at resistance. The resistance has been tested 6 times a breakout of such a pattern will give good returns. Wait for clear breakout above 448 before taking entry.

VAIBHAVGBL raising waves - Weekly Time FramesNSE:VAIBHAVGBL Seems like it has completed wave 1 on the Monthly Time frame since its inception.
Wave 2 also completed with a deep retracement to about 78% from an all-time high.
If wave 2 completion is assumed, following Elliot wave principles, wave 3 is usually fast-paced and crosses above the last all-time high in less time than the time taken for the last all-time high.

VAIBHAVGBL: Golden Buying Opportunity Ahead!Vaibhav Global appears to have emerged from a prolonged period of sideways consolidation, marking a significant breakout. Following the breakout, a corrective wave (ABC pattern) ensued, bringing the prices back to its golden buying zone. Subsequently, the prices have initiated an upward movement from this pivotal zone, indicating a potential buying opportunity.
📈 This development suggests a favorable outlook with initial upward targets set between 557 to 574. However, it's noteworthy that these levels might pose as initial resistance, particularly on a broader time frame. Upon surpassing this resistance level, which may involve a retracement ranging between 35% to 50%, the prices could witness further upward momentum, potentially targeting 661.
For traders operating within shorter time frames, it's advisable to set an initial stop loss at 421, while investors may consider a slightly lower stop loss at 394 to manage risk effectively. This strategic approach aligns with capitalizing on the current buying opportunity while adhering to prudent risk management practices. 🛡️

Long Term Great StockGood company with steady business long term good prospect. Foreign investors are having good faith in the stock.

💥Vaibhav Global💥-Nice Breakout💥Vaibhav Global💥-Nice Breakout
Capital to be deployed-20k
Investing Price-510-514
Breakout Price-507
Stoploss-433
Targets-694-744-901
RT for max reach
#vaibhavglobal #stockstowatch #StocksToBuy #StocksInFocus #stocks #StockMarket

Vaibhav Global - Breaking out of multi-year consolidation!Stock is on the verge of a 2 year long consolidation break out.
Volume build up in the past few weeks is encouraging and suggests that buying interest is back in the stock
The price has formed a nice base near the 20 WEMA since Aug, 2023. It broke out of this base this week.
The zone from 500 to 530 has acted as a multiple support and resistance zone in the past. A weekly close above this zone will be very positive.
Indicators such as the Mansfeld Relative Strength and Minervini Trend Template are positive and suggest that the stock is in Stage 2 up trend. The runway to the previous ATH is long and provides possibility of decent returns in the coming quarters.
Disclaimer: This is not investment advice. The chart is posted for educational purpose. The reader should consult a certified financial advisor if he/she plans to buy or sell based on this post.

VAIBHAV GLOBAL - BOTTOMED OUTVaibhav Global looks like it has bottomed out...
I will look to buy on dips...Structure is very Positive on Monthly Time frame.
We will revisit in January 2025...
340 to 360 should be strong support zones

Vaibhav Global - At Support ZonesVaibhav Global is at support zone of 423 to 417...Expecting this stock to maintain BULL trend and start moving towards 500 550 zones in coming weeks.
Stoploss 390 on closing basis (Swing Traders).
For very small duration traders below 415 can exit.
Overall Stock is in Stage 2. Already recommended earlier please check my old idea on monthly chart.

VAIBHAVGBLStock name = Vaibhav Global Limited.
Weekly chart setup
Chart is self explanatory. Levels of breakout, possible up-moves (where stock may find resistances) and support (close below which, setup will be invalidated) are clearly defined.
Master Score = B
This stock has some positives. However, its mediocre earnings and mediocre price performance suggest it still needs to prove itself.
Disclaimer: This is for demonstration and educational purpose only. this is not buying and selling recommendations. I am not SEBI registered. please consult your financial advisor before taking any trade.

VaiBhav Global Very Clear Monthly Breakout VaiBhav Global Very Clear Weekly and Monthly Breakout At 518.5 price if sustain above 518.5 After possible Good moment At target price Fibonacci As per target is 578-691-828++++ Stoploss 376

Inverse Head & Shoulders in VAIBHAVGBL - Vaibhav globalHi All,
Greetings of the day!
Technical view:
Last couple of days market is showing some profit booking but this script is showing strength which adds confidence that its with strong hands.
The script has been forming base since April 2022 and today has formed inverse head and shoulders on weekly charts as shared.
The script is forming higher high higher lows ( following DOW theory ) and the upmoves are supported with higher than average volumes showing strength.
Based on the height of the triangle levels of 850 can be seen first and eventually all time highs near 1000.
I will timely share my views according to the moves.
Stop loss can be below 400 on weekly closing basis. The risk reward is approximately 1:5 which makes it attractive at current levels.
We see breakout today to form higher high higher low with big volumes.
The volumes are supporting the up-move which is a good indication.
Some sectoral and fundamental view:
The Consumption sector( especially consumer discretionary ) in India has high probability to grow fast as the per capita income is estimated to grow from 2000$ to 10,000$ in coming years. The diamond, gems & jewellery industry is estimated to grow well due to this.
India is global player in this sector and the government of India is also focussing on this sector . Just look at this example : en.wikipedia.org
Names like Titan are doing well which is sector leader .
Vaibhav global is a global player with big presence in US and EU.
***If you like my analysis , then do follow me for more updates and like it so others can also benefit from this :) ***
Enjoy the move and hope you are making most of it by learning how the momentum stocks show strength :)
Happy trading ;)

Vaibhav Global Breaking OutPrice giving breakout of Flag & Pole pattern as well as Down Sloping Trendline. Resistance are around 500 and 600 level where as support are at 415 and deep support at 390 level.
Disclaimer: Personally Holding and I am Not SEBI Registered. Chart shared for Educational Purpose only. Kindly do your own analysis before taking any Position

VAIBHAVGBLNSE:VAIBHAVGBL
Closing over trend line
Good Volume Breakout
Rsi >60
Macd In Buy
MA showing Buy
Support@ 417
Stop Loss- 400
Target--- 480/512/545/600+
Compete long term swing trade

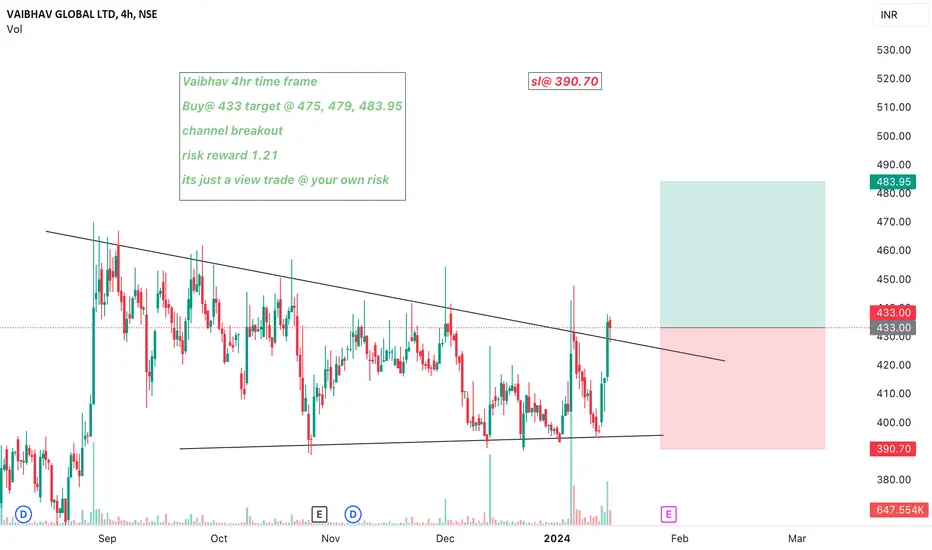
Vaibhav 4hr time frame Buy@ 433 target @ 475, 479, 483.95 Vaibhav 4hr time frame
Buy@ 433 target @ 475, 479, 483.95
channel breakout
risk reward 1.21
its just a view trade @ your own risk
sl@ 390.70
VAIBHAVGBLStock trading above 100 DMA as well as above 20℅ reverse from last 6 month Low ,
It's Bullish sing

#VAIBHAVGBL bullish flag breakout LongVaibhavgbl breaking out for bullish flag pattern range, stock is trading in range from September,
today its trying to break trendline to the north side in overall bullish trend, Volume is increasing as well.

Vaibhav global Breakout trading implementation:
1. **Identifying New Trends:** Breakout trading helps traders identify the beginning of new trends by focusing on price levels where an asset breaks out of its historical trading range.
2. **Volatility Indicator:** Breakouts often occur when there's increased volatility in the market. Monitoring breakouts can provide insights into shifts in market sentiment and potential price movements.
3. **Entry Points:** Breakout points serve as potential entry points for traders looking to ride the momentum of a newly established trend. Buying on a breakout can capture the early stages of a price movement.
4. **Confirmation of Strength:** Successful breakouts indicate the strength of a trend. If an asset breaks out with high volume and follows through with sustained price movement, it suggests a strong trend in that direction.
5. **Avoiding False Signals:** Breakout strategies often include using indicators or confirmation signals to avoid false breakouts. This can enhance the accuracy of trade decisions.
6. **Defined Risk and Reward:** Breakout trading allows for setting clear stop-loss levels below the breakout point, which helps manage risk. Traders can also calculate potential profits based on the distance between the breakout point and a projected target.
7. **Adaptable to Various Markets:** Breakout trading can be applied to various markets, including stocks, forex, commodities, and cryptocurrencies. The concept remains consistent across different assets.
8. **Flexibility:** Traders can adapt breakout strategies to their preferred timeframes, whether they are day traders, swing traders, or long-term investors.
9. **Liquidity Opportunities:** Breakout points are often associated with increased trading volume, which can provide better liquidity for executing trades.
10. **Risk vs. Reward Assessment:** Traders can evaluate the potential risk of a trade (stop-loss) against the potential reward (target price), aiding in decision-making and portfolio management.
11. **Psychological Advantage:** Successful breakout trades can boost a trader's confidence and discipline, reinforcing the effectiveness of their strategy.
12. **Market Events:** Breakouts can occur around significant market events such as earnings reports, economic data releases, or geopolitical developments, offering traders opportunities to capitalize on sudden price movements.
Remember, while breakout trading offers potential advantages, it also carries risks. False breakouts and market reversals can lead to losses. Successful implementation requires a solid understanding of technical analysis, risk management, and the ability to adapt to changing market conditions.
