VAKRANGEE trade ideas

Amazing breakout on WEEKLY Timeframe - VAKRANGEECheckout an amazing breakout happened in the stock in Weekly timeframe, macroscopically seen in Daily timeframe. Having a great favor that the stock might be bullish expecting a staggering returns of minimum 25% TGT. IMPORTANT BREAKOUT LEVELS ARE ALWAYS RESPECTED!
NOTE for learners: Place the breakout levels as per the chart shared and track it yourself to get amazed!!
#No complicated chart patterns
#No big big indicators
#No Excel sheet or number magics
TRADE IDEA: WAIT FOR THE STOCK TO BREAKOUT IN WEEKLY TIMEFRAME ABOVE THIS LEVEL.
Checkout an amazing breakout happened in the stock in Weekly timeframe.
Breakouts happening in longer timeframe is way more powerful than the breakouts seen in Daily timeframe. You can blindly invest once the weekly candle closes above the breakout line and stay invested forever. Also these stocks breakouts are lifelong predictions, it means technically these breakouts happen giving more returns in the longer runs. Hence, even when the scrip makes a loss of 10% / 20% / 30% / 50%, the stock will regain and turn around. Once they again enter the same breakout level, they will flyyyyyyyyyyyy like a ROCKET if held in the portfolio in the longer run.
Time makes money, GREEDY & EGO will not make money.
Also, magically these breakouts tend to prove that the companies turn around and fundamentally becoming strong. Also the magic happens when more diversification is done in various sectors under various scripts with equal money invested in each N500 scripts.
The real deal is when to purchase and where to purchase the stock. That is where Breakout study comes into play.
LET'S PUMP IN SOME MONEY AND REVOLUTIONIZE THE NATION'S ECONOMY!


SWING TRADE ANALYSISPleasure to have you here. This is an analysis done for the Tickr, and potential in the Technicals.
In this Chart ,which has been slightly in uptrend and as soon as it crosses its resistance, OR is at support levels we will decide to make a position in the stock,
if you like the idea please like the post :) It will be a motivation to further such ideas.
Disclaimer Note:-
1) This is just an analysis setup and no advice to trade/trade
2) If you are making position, please have your risk to reward analysis and then enter.
3) The analysis and target shared does not mean i trade in them, entry and exit depends on the market open and other factors.

Falling wedgeStock has broken 4.5 year falling wedge pattern. Buy at 34.50 for targets of 68.9/150.3/215.20/408.55

trendline breakoutstock has give strong trend line breakout with good volume , should see positive upside

VAKRANGEE - WEEKLY TIME FRAMEThe Structure looks good to us, waiting for this instrument to correct and then give us these opportunities as shown on this instrument (Price Chart).
Note: its my view only and its for educational purpose only. only who has got knowledge about this strategy, will understand what to be done on this setup. its purely based on my technical analysis only (strategies). we don't focus on the short term moves, we look for only for Bullish or Bearish Impulsive moves on the setups after a good price action is formed as per the strategy. we never get into corrective moves. because it will test our patience and also it will be a bullish or a bearish trap. and try trade the big moves.
we do not get into bullish or bearish traps. we anticipate and get into only big bullish or bearish moves (Impulsive moves).
Just ride the bullish or bearish impulsive move. Learn & Know the Complete Market Cycle.
buy low and sell high concept. buy at cheaper price and sell at expensive price.
Keep it simple, keep it Unique.
please keep your comments useful & respectful.
Thanks for your support....


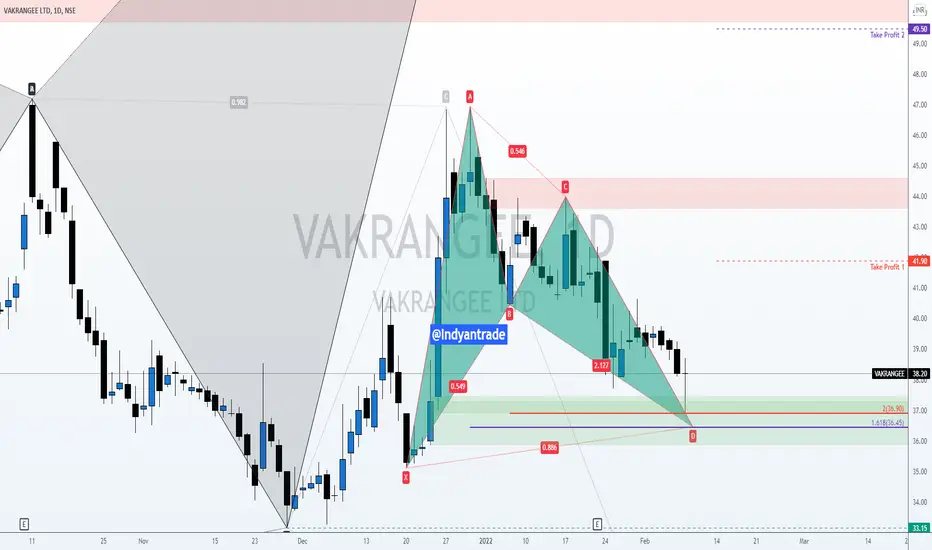
Vakrangee - BAT - BAMMVakrangee has bat at daily timeframe and prz at demand zone. in weekly butterfly or bat are possible.
Vakrangee can give good moveVakrangee to break a triangle pattern. One can go long if it breaks the pattern with good volume

Varkrangee - ready for break-outStock was following a downward trend-line and ready for upward movement.

VAKRANGEE Accumulation Phase Explained In Very Short.NSE:VAKRANGEE
Today we will be having a look at the weekly chart of VAKRANGEE which is currently in a re accumulation zone. The main topic of this post is going to be how we can identify whether any stock is in accumulation phase or not.
So, if you can see weekly chart of VAKRANGEE I have already plotted support and resistance levels for VAKRANGEE.
Support for this stock is in area of 24-34 from where we have seeing strong buying check the points Marked with E,F,G,H I and J where you can clearly see the strong buying is happening whenever stock comes in to that area which is confirming by supporting volume at those areas.
If we look at resistance, level of 71 is good resistance for this counter but look at points A,B,C and D from where we have seen prices moving down, but wait look at volume at same levels its started drying out as prices moving down.
Both of this actions near support and resistance levels indicating that some one is buying on each deep or Accumulating VAKRANGEE and that someone will definitely be the Professional traders of so called smart money.
And last weeks up move may be final intimation of up coming uptrend in VKRANGEE because if you can see points H I J they are forming higher lows now while all three points before those were forming lower lows which indicates change in trend.
Still Level of 71 will be very important for VAKRANGEE and after that stock will shoot up nicely.
Thanks For Reading.
|| Hari Om ||
|| Shree Ram ||
|| Ambadnya ||


Add it to watch list buy at 27 rs cmp 42.5Xabcd pattern will form in weekly chart when stock corrects till 27 rs level

vakrangee as per harmonic pattern -51.85 -53Strictly for learning purpose.Anyone who has mastered harmonic pattern.advice from u ,will be welcomed .

Vakrangee - BullishVakrangee CMP - 64.25
Looking bullish in higher time frame. One can go for Swing / Short term Trade setup with the following entry, exit & targets
Buy Range 61 - 65 / Stop Loss 50.55
Target 1 - 75
Target 2 - 80
Target 3 – 85 / 90
Disclaimer: This is my view and for educational purpose only.

Little bit happening keep eye on 69 levelOn weekly chart there is hug volume
Rsi above 60
Keep eye on 69 level and maybe little buy on this share with sl 55


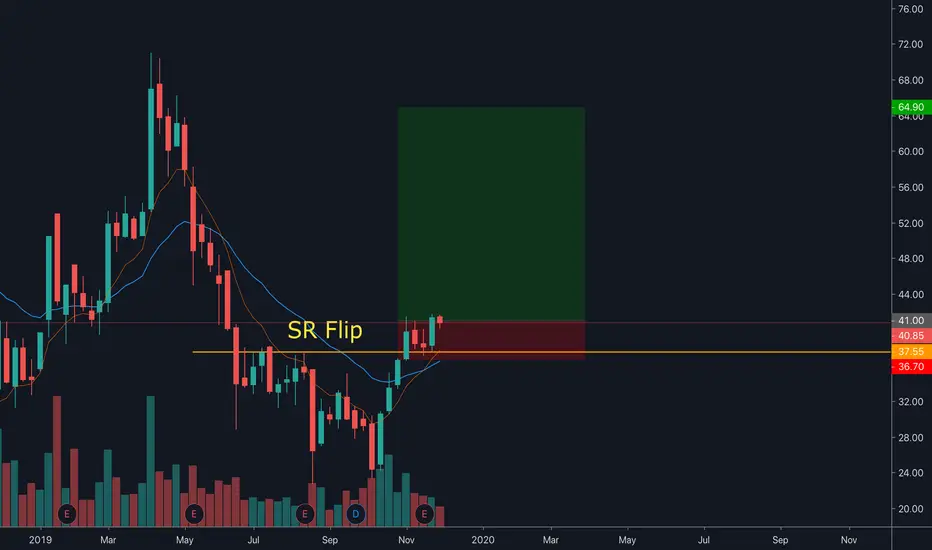
Vakrangee long textbook setup with bullish structure Vakrangee long textbook setup with bullish structure
Sr Flip and good Emma support

Vakrangee has crossed resistanceVakrangee has crossed 1/8 resistance and may turn bullish from today onwards
