VBL on support line in Daily chartVBL moving in channel and it's on support line now
Good fundamentals
VBL trade ideas

Strong Buy-Varun Beverage-VBL
Strong Buy above 1619
T1-1674
T2-1760
SL-1551
26.06.2026
1. Inside candle broken
2. Range broken and price taken retracement
3. Wait for weekly green candle
4. Price rejection at 0.618 Fibonacci
5. Previous resistance turned to support

Just A View - VBL 📊 Script: VBL
📊 Sector: FMCG
📊 Industry: Food - Processing - Indian
Key highlights: 💡⚡
📈 Script is trading in consolidation zone since last few trading session.
📈 Script has to give breakout or breakdown to came put of consolidation zone.
📈 For breakout script has to give closing above 1644, and for breakout script has to give closing below 1578
KEEP AN EYE ON STOCK
⚠️ Important: Always maintain your Risk & Reward Ratio.
✅Like and follow to never miss a new idea!✅
Disclaimer: I am not SEBI Registered Advisor. My posts are purely for training and educational purposes.
Eat🍜 Sleep😴 TradingView📈 Repeat 🔁
Happy learning with trading. Cheers!🥂

VBL/SWING TRADE# ENGULFING CANDLE AT RTST LEVEL
#TALING SUPPORT FROM MA21 EMA 21
# SL 1573
ALWAYS TAKE RISK REWARDS INTO ACCOUNT. IT IS THE CORE STRENGTH OF TRADING.
NO MATTER WHAT END OF THE DAY WHAT YOU EARN - WHAT YOU LOSE =RETURNS
"Investing in the stock market involves balancing risk and reward. Higher potential returns typically come with higher risk, while safer investments may offer lower returns. It's essential to assess your risk tolerance and investment goals carefully. Diversifying your portfolio can help manage risk. Remember, informed decisions and a long-term perspective are key to navigating the complexities of the market."

Varun BeveragesNice breakout towards highs
+ Box Breakout
+ RSI catching up
+ Volumes ctaching up
+ Evergreen sector

Varun Beverages Ltd *Varun Beverages Ltd*
P&F Formation on Weekly Basis.
Strong Price BreakOut & Sustained.
Need to Continue & be Watched.
Might enter _Distribution_ stage.
Strong Vol Consolidation. Continued Traction required. To be Watched.
Strong Bearish Divergence on Weekly Basis.
*Do Your Own Research as well. This is an Opinion*
*_Happy Investing_*🤓

VBL - 4 months RECTANGLE══════════════════════════════
Since 2014, my markets approach is to spot
trading opportunities based solely on the
development of
CLASSICAL CHART PATTERNS
🤝Let’s learn and grow together 🤝
══════════════════════════════
Hello Traders ✌
After a careful consideration I came to the conclusion that:
- it is crucial to be quick in alerting you with all the opportunities I spot and often I don't post a good pattern because I don't have the opportunity to write down a proper didactical comment;
- since my parameters to identify a Classical Pattern and its scenario are very well defined, many of my comments were and would be redundant;
- the information that I think is important is very simple and can easily be understood just by looking at charts;
For these reasons and hoping to give you a better help, I decided to write comments only when something very specific or interesting shows up, otherwise all the information is shown on the chart.
Thank you all for your support
🔎🔎🔎 ALWAYS REMEMBER
"A pattern IS NOT a Pattern until the breakout is completed. Before that moment it is just a bunch of colorful candlesticks on a chart of your watchlist"
═════════════════════════════
⚠ DISCLAIMER ⚠
The content is The Art Of Charting's personal opinion and it is posted purely for educational purpose and therefore it must not be taken as a direct or indirect investing recommendations or advices. Any action taken upon these information is at your own risk.

Varun Beverages Limited (VBL)In this video, we go through the detailed fundamental and technical analysis of Varun Beverages Limited (VBL) discussing our entry into this stock with technical analysis on Daily, Weekly and Monthly chart.
The stock has been in a continuous uptrend looks a bit in the intermediate, but if bounces back, it shall be much stronger.
Do watch the video for detailed analysis and provide your suggestions!

Varun Beverages #VBL. All ingredients present for a Breakout
Showing good Relative Strength
Hovering around the top of a 14wk/ 13% shallow base.
got some VCP action going
Volume & volatility have dried up in last few sessions.
Results are also out of the way
Entry 1518 SL 1470 Target 3RR

Keep An Eye - Consolidation Breakout Soon - VBL📊 Script: VBL
📊 Sector: FMCG
📊 Industry: Food - Processing - Indian
Key highlights: 💡⚡
📈 Script is trading near its resistance level which is 1477.
📈 Script is trading at upper band of BB and giving breakout of it.
📈 MACD and Double Moving Average are giving crossover .
📈 Right now RSI is around 62.
📈 One can go for Swing Trade only above 1477.
BUY ONLY ABOVE 1477
⏱️ C.M.P 📑💰- 1475
🟢 Target 🎯🏆 - 1561
⚠️ Stoploss ☠️🚫 - 1433
⚠️ Important: Always maintain your Risk & Reward Ratio.
✅Like and follow to never miss a new idea!✅
Disclaimer: I am not SEBI Registered Advisor. My posts are purely for training and educational purposes.
Eat🍜 Sleep😴 TradingView📈 Repeat 🔁
Happy learning with trading. Cheers!🥂

Target locked at 1600: Varun Beverages poised for growthUnlock the potential of Varun Beverages as it charts a course towards the target of 1600. With a strategic stop loss at 1360, safeguard your investment while aiming for growth. Stay vigilant, stay profitable

Vbl for swingQuick 10% target with strict stop loss
Summer is near so demand will shoot up.
Good for long term play also,accumulate at dips.

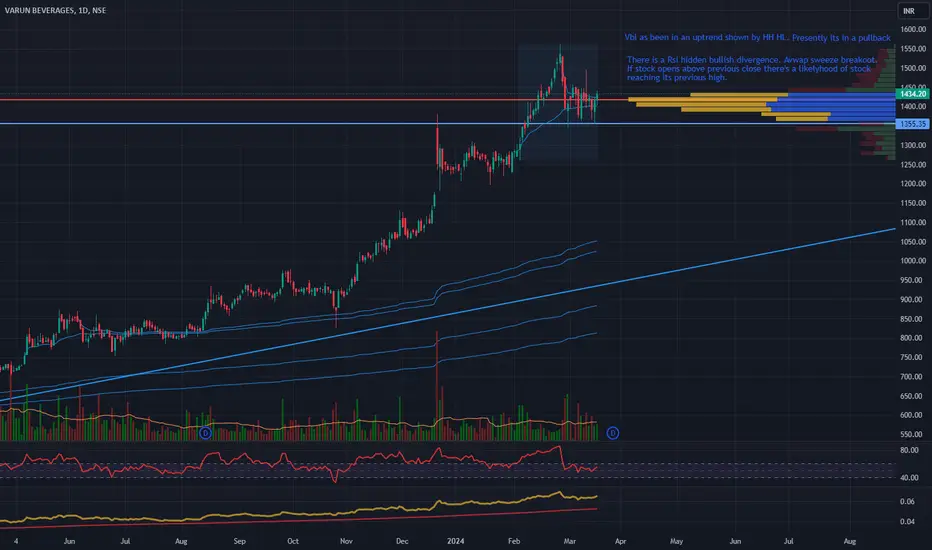
Varun beverages limitedBreakout above Point of control. Avwap squueze breakout. Presence of rsi hidden divergence.
VARUN BEVERAGES(VBL) looking strong according to price actionInitiating a long position on Varun Beverages Limited (VBL) with a stop-loss set at 1329.85 and a take-profit level of 1547 suggests a carefully considered trading strategy based on technical analysis and risk management.
A long position indicates a bullish outlook on the stock, with the expectation that its price will rise. Traders employing this strategy anticipate favorable market conditions for Varun Beverages, aiming to profit from the potential upward movement.
Setting a stop-loss at 1329.85 is a prudent risk management measure. If the stock were to move against the long position and reach or fall below this level, the position would be automatically closed. This helps limit potential losses, allowing traders to adhere to predefined risk tolerance levels and protect their capital.
The take-profit level at 1547 indicates a target price where the trader aims to secure profits by selling the position. This level represents a point where the trader believes the stock will experience a significant increase, providing an opportunity to exit the position with gains.
It's important for traders to stay updated on market developments and news related to Varun Beverages, as external factors can influence the stock's movement. Regularly reassessing the trade and considering potential adjustments to stop-loss or take-profit levels is advisable to align with changing market conditions.
This is for educational purpose only.

Long, Risk Reward is good. Big deal/order from South Africa Long, Risk Reward is good. Big deal/order from South Africa

Varun Beverages Ltd Trading Signal📈 **Varun Beverages Ltd Trading Signal:**
🔵 Buy above: 1051
🔴 Stop Loss @: 959

VBLChart set-up very Bullish
Short term DEMA give buying signal
Macd Bullish crossover
RSI Bullish
Good to buy
Stock price soon in 4 digits
Disclaimer This is my personal view for education purpose only
No Buy sell recommendations.

Bearish This stock have fundamental good stock
Technically this stock breakdown from major support now stock can go low level
Take own analysis
No recommendation for buy and sell


VBL longTrendline support & bounce back
Also 20DEMA as a dynamic support
Price above all the DEMA
RSI Bullish
Setup is good for long position.
Disclaimer This is my personal view for education purpose only.

VBL--Bearish viewA strong rise is observed in this stock, after breaking the trendline.
now this stock is showing bearish pressure.
now the price is at important level of resistance, showing strong bearish pressure.
this is the right time to look for short, short side until price reach the demand zone..

Huge Flag Pattern Breakout Seen in Varun Beverages | Fly in Sky ABOUT COMPANY:-
Varun Beverages Ltd has been associated with PepsiCo since the 1990s and is a key player in beverage industry and one of the largest franchisee of PepsiCo in the world. The company produces and distributes a wide range of carbonated soft drinks, non-carbonated drinks and packaged water sold under trademarks owned by PepsiCo.
PepsiCo brands produced and sold by the company include Pepsi, Seven-up, Mirinda Orange, Mountain Dew, Tropicana Juices and many more.
Market Cap
₹ 1,10,347 Cr.
Current Price
₹ 849
High / Low
₹ 874 / 454
Stock P/E
58.7
Book Value
₹ 50.0
Dividend Yield
0.15 %
ROCE
27.8 %
ROE
33.5 %
Face Value
₹ 5.00
Debt
₹ 3,726 Cr.
EPS
₹ 14.5
PEG Ratio
1.19
Promoter holding
63.6 %
Intrinsic Value
₹ 294
Pledged percentage
0.04 %
EVEBITDA
33.6
PROS
Company has delivered good profit growth of 49.2% CAGR over last 5 years
Company has been maintaining a healthy dividend payout of 17.6%
Company's median sales growth is 18.3% of last 10 years
CONS
Stock is trading at 17.0 times its book value
Company might be capitalizing the interest cost
So, Guy's i have written most of the things on chart and here, but i want to tell you a secret this is good fundamentally company to invest and forget for long term. But if you are going just for trading then please follow given stop loss in it.
Disclaimer:- Please always do your own analysis or consult with your financial advisor before taking any kind of trades.
Dear traders, If you like my work then do not forget to hit like and follow me, and guy's let me know what do you think about this idea in comment box, i would be love to reply all of you guy's.
Thankyou.

Momentum stockA stock is ready for breakout but focus on risk management and stop loss
It's called techno funda
