Next report date
—
Report period
—
EPS estimate
—
Revenue estimate
—
39.00 INR
149.88 B INR
1.54 T INR
1.62 B
About VEDANTA LTD
Sector
Industry
Website
Headquarters
Mumbai
Founded
1965
ISIN
INE205A01025
FIGI
BBG000CZGB60
Vedanta Ltd. is a natural resource company, which engages in the exploration, extraction, and processing of minerals, oil, and gas properties. It operates through the following segments: Copper, Aluminum, Iron Ore, Power, and Oil & Gas. The Copper segment focuses in custom smelting and also include a copper smelter, a refinery, a phosphoric acid plant, a sulphuric acid plant, a copper rod plant, and three captive power plants. The Aluminum segment comprises refinery and a captive power plant at Lanjigarh and a smelter, a thermal coal based captive power facility at Jharsuguda both situated in the State of Odisha in India. The Iron Ore segment explores, mines, and processes iron ore, pig iron, and metallurgical coke. The Power segment consists 600 MW thermal coal-based commercial power facility at Jharsuguda in the State of Odisha in Eastern India. The Oil and Gas segment involves in the exploration and development and production of oil and gas. The company was founded by Dwarka Prasad Agarwal on June 25, 1965 and is headquartered in Mumbai, India.
Related stocks
VEDL Long_Support @ 20 DEMAVEDL Long:
- Price support @ 20 DEMA
- Enter when prices are favorable
-SL: Close below 20 DEMA

Looking to buy Vedanta above 475..Looking to buy Vedanta above 475, when it breaks decisively
looking for a final target of 525 and more
total swing trade
very very high probable trade.
keep an eye above 475 levels.

VEDANTA LTD KEY ZONE..This is the 1 hour chart of VEDL.
VEDL is currently trading near its pattern (Broadening) resistance zone in the 462–465 range.
The stock is trading with in a channel, with its support zone in the 440–445 and resistance zone 485-495 range on the hourly chart.
If this level is sustain,we may see h

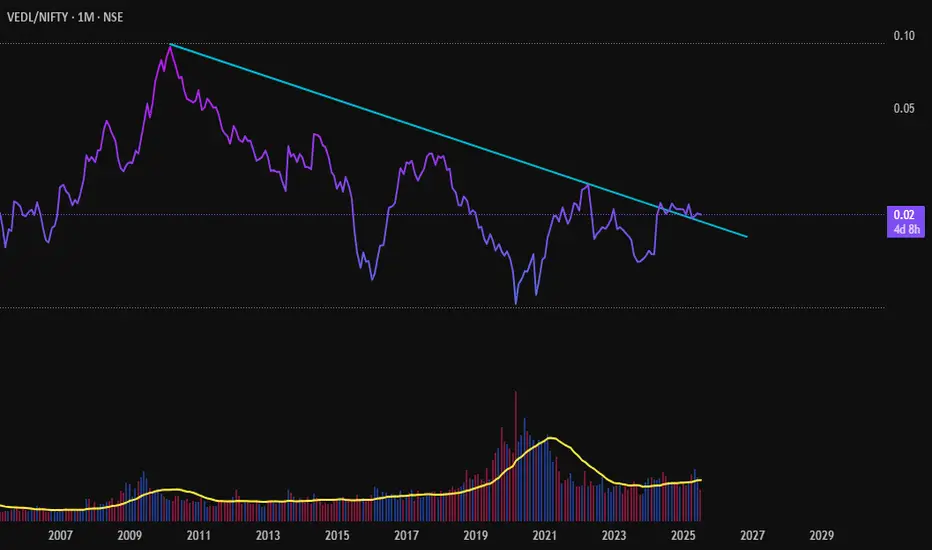
VEDANTA
Red Arrows (Resistance Points):
The three red arrows indicate the points where the stock touched the trendline and then faced a decline.
These points represent resistance levels where selling pressure pushed the price down.
---
Breakout Attempt:
Towards the end of the chart (around May 2025),

Vedanta : In a Buy trajectory.Next level to watch for is 470
Vedanta : In a Buy trajectory.Next level to watch for is 470
( Not a Buy / Sell Recommendation
Do your own due diligence ,Market is subject to risks, This is my own view and for learning only .)

Vedanta Share Support Level?Vedanta Ltd is approaching a crucial support level that traders and investors should closely watch. Based on recent price action and technical analysis, this level could act as a strong buying zone. A bounce from this support may signal a potential upside move in the coming sessions.
📉 Support Level

Vedanta at Crucial Zone – Breakdown or Breakout?🔹 Description:
Vedanta Ltd (VEDL) is trading at a critical price zone, where a breakout above ₹ while a breakdown below ₹ may invite further selling pressure with downside targets of ₹ .
🔸 Watch key levels closely:
Support: ₹
Resistance: ₹
Confirmation with volume and RSI divergence can help v


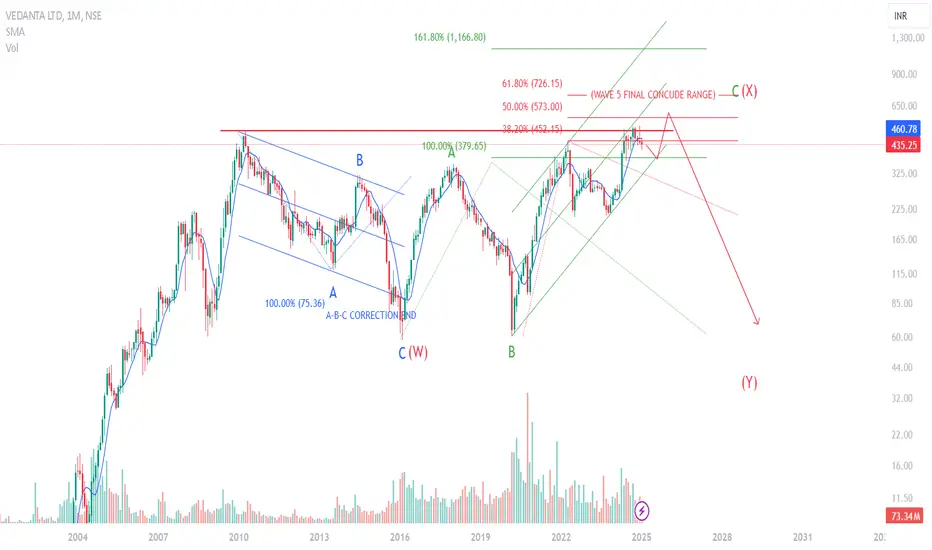
VEDANTA LIMITED VIEW MONTHLY TIME FRAME.Vedanta Limited - technical view
VEDL is currently in complex correction. Wave (w)-completed, wave (X) - ongoing. In wave (X) - wave (a) & (b) completed & stock is currently in wave c(X). Big fall is coming in VEDL.
See all ideas
Summarizing what the indicators are suggesting.
Neutral
SellBuy
Strong sellStrong buy
Strong sellSellNeutralBuyStrong buy
Neutral
SellBuy
Strong sellStrong buy
Strong sellSellNeutralBuyStrong buy
Neutral
SellBuy
Strong sellStrong buy
Strong sellSellNeutralBuyStrong buy
An aggregate view of professional's ratings.
Neutral
SellBuy
Strong sellStrong buy
Strong sellSellNeutralBuyStrong buy
Neutral
SellBuy
Strong sellStrong buy
Strong sellSellNeutralBuyStrong buy
Neutral
SellBuy
Strong sellStrong buy
Strong sellSellNeutralBuyStrong buy
Displays a symbol's price movements over previous years to identify recurring trends.
931VL27
VL-9.31%-03-12-27-PVTYield to maturity
—
Maturity date
Dec 3, 2027
874VL32
VL-8.74%-29-6-32-PVTYield to maturity
—
Maturity date
Jun 29, 2032
RRVL11724
VL-SWAP+SPREAD-10-10-25-PVTYield to maturity
—
Maturity date
Oct 10, 2025
95VL27
VEDANTA LIMITEDYield to maturity
—
Maturity date
Aug 20, 2027
92VL30
VL-9.20%-25-2-30-PVTYield to maturity
—
Maturity date
Feb 25, 2030
VL050625
VL-3M OIS+SPREAD 04-06-27-PVTYield to maturity
—
Maturity date
Jun 4, 2027
945VL28
VL-9.45%-05-06-28-PVTYield to maturity
—
Maturity date
Jun 5, 2028
94VL27
VEDANTA LIMITEDYield to maturity
—
Maturity date
Feb 20, 2027
See all VEDL bonds
Curated watchlists where VEDL is featured.

Frequently Asked Questions
The current price of VEDL is 443.55 INR — it has decreased by −1.73% in the past 24 hours. Watch VEDANTA LTD stock price performance more closely on the chart.
Depending on the exchange, the stock ticker may vary. For instance, on NSE exchange VEDANTA LTD stocks are traded under the ticker VEDL.
VEDL stock has fallen by −0.18% compared to the previous week, the month change is a −0.98% fall, over the last year VEDANTA LTD has showed a 3.43% increase.
We've gathered analysts' opinions on VEDANTA LTD future price: according to them, VEDL price has a max estimate of 607.00 INR and a min estimate of 445.00 INR. Watch VEDL chart and read a more detailed VEDANTA LTD stock forecast: see what analysts think of VEDANTA LTD and suggest that you do with its stocks.
VEDL reached its all-time high on Dec 16, 2024 with the price of 526.95 INR, and its all-time low was 0.95 INR and was reached on Oct 24, 2000. View more price dynamics on VEDL chart.
See other stocks reaching their highest and lowest prices.
See other stocks reaching their highest and lowest prices.
VEDL stock is 1.99% volatile and has beta coefficient of 1.75. Track VEDANTA LTD stock price on the chart and check out the list of the most volatile stocks — is VEDANTA LTD there?
Today VEDANTA LTD has the market capitalization of 1.73 T, it has increased by 1.94% over the last week.
Yes, you can track VEDANTA LTD financials in yearly and quarterly reports right on TradingView.
VEDANTA LTD is going to release the next earnings report on Jul 28, 2025. Keep track of upcoming events with our Earnings Calendar.
VEDL earnings for the last quarter are 9.40 INR per share, whereas the estimation was 10.07 INR resulting in a −6.70% surprise. The estimated earnings for the next quarter are 8.70 INR per share. See more details about VEDANTA LTD earnings.
VEDANTA LTD revenue for the last quarter amounts to 397.89 B INR, despite the estimated figure of 389.94 B INR. In the next quarter, revenue is expected to reach 367.81 B INR.
VEDL net income for the last quarter is 34.83 B INR, while the quarter before that showed 35.47 B INR of net income which accounts for −1.80% change. Track more VEDANTA LTD financial stats to get the full picture.
VEDANTA LTD dividend yield was 9.37% in 2024, and payout ratio reached 111.63%. The year before the numbers were 10.86% and 258.74% correspondingly. See high-dividend stocks and find more opportunities for your portfolio.
As of Jul 27, 2025, the company has 117.26 K employees. See our rating of the largest employees — is VEDANTA LTD on this list?
EBITDA measures a company's operating performance, its growth signifies an improvement in the efficiency of a company. VEDANTA LTD EBITDA is 423.43 B INR, and current EBITDA margin is 28.51%. See more stats in VEDANTA LTD financial statements.
Like other stocks, VEDL shares are traded on stock exchanges, e.g. Nasdaq, Nyse, Euronext, and the easiest way to buy them is through an online stock broker. To do this, you need to open an account and follow a broker's procedures, then start trading. You can trade VEDANTA LTD stock right from TradingView charts — choose your broker and connect to your account.
Investing in stocks requires a comprehensive research: you should carefully study all the available data, e.g. company's financials, related news, and its technical analysis. So VEDANTA LTD technincal analysis shows the sell today, and its 1 week rating is buy. Since market conditions are prone to changes, it's worth looking a bit further into the future — according to the 1 month rating VEDANTA LTD stock shows the buy signal. See more of VEDANTA LTD technicals for a more comprehensive analysis.
If you're still not sure, try looking for inspiration in our curated watchlists.
If you're still not sure, try looking for inspiration in our curated watchlists.