VEDL trade ideas


# 23 Long Vedanta, to Ride the trendNSE:VEDL
Price taking support at Kijun Sen and the close proximity of Tenken and kijun make risk: reward quite favorable
Views Negated below: 125 on Closing Basis
#Disclaimer: I'm not a SEBI Registered Research Analyst, These are my views, please consult your Investment Advisor before buying and selling any position. This is just for Education Purpose.

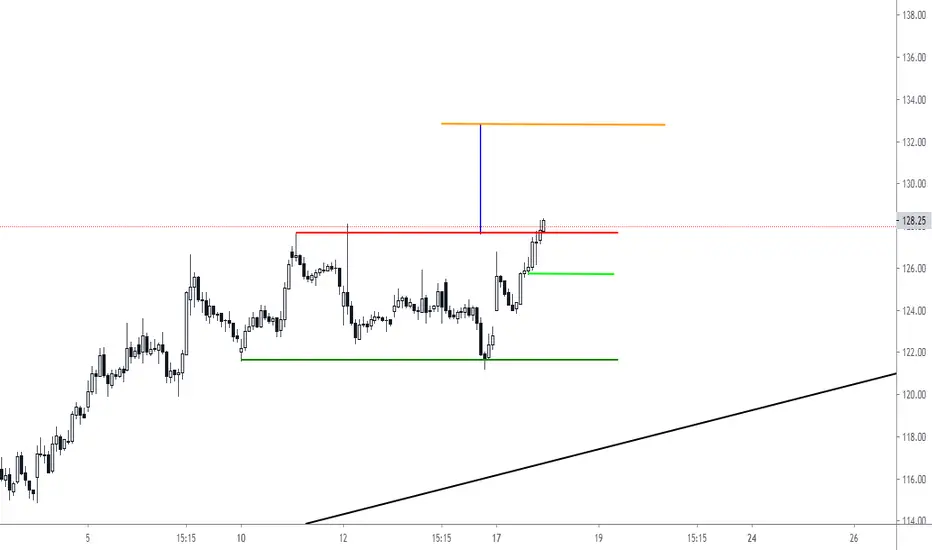
VEDL - LONG - Late in posting - ascending triangle breakoutascending triangle breakout - could trail once target is acheived


LONG-IF OPENS ABOVE SUSTAINS REDLINE -RISKYLONG-IF OPENS ABOVE REDLINE .SHOWS DIFFERENT WICKS ON FYERS TRADING VIEW..CLOSE ABOVE ONLY CAN GO LONG

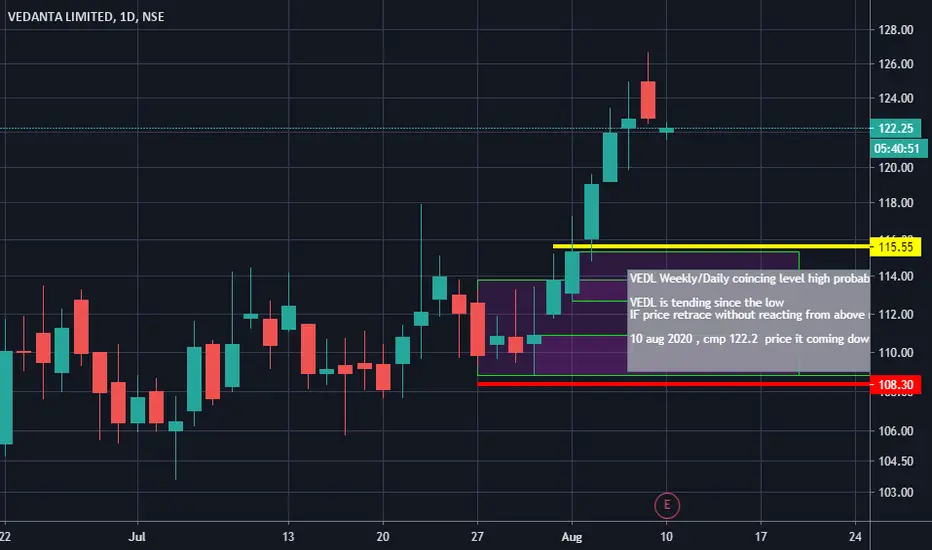
VEDL Weekly/Daily demand level high probability trade 115-108 VEDL Weekly/Daily coincing level high probability trade 115-108
VEDL is tending since the low
IF price retrace without reacting from above monthly Supply zone, I will enter this trade.
10 aug 2020 , cmp 122.2 price it coming down
VEDLNSE:VEDL
THIS HAS FINALLY BEEN ABLE TO FLY, IT HAS CROSSED 122 LEVELS OF MARCH AND TRYING TO SUSTAIN THOSE
IF IT SUSTAINS 122.50, ITS GOING TO REACH FOR 126 AND THEN FOR 130
THE OI ADDITION IN PUTS OF 120 SHOWS BULLISHNESS........... HAVE IT ON UR LIST
******************************************************************************************************************************************************************
Hi all,
Its pleasure to have you all here.
I have started putting these charts as a contribution from my side to all people who are new to business, as I had to struggle a lot without any sources at disposal. So please consider this a just small contribution from my side.
Few Honest Disclosures:
1. Any idea shared is my personal view, its not a recommendation, neither any kind of paid propaganda, so please
do your bit of research.
2. Ideas shared does not mean that I trade all or have position in them, this is just a helping hand to all.
3. I expect no comments or like nor any negativity, as I said its just a small helping hand from my side, please plan your risk and trade as per your capacity.
4. To trade in Cash, options or futures is your sole choice and your own risk
5. I am no expert in Tech Indicators, I believe in support resistance and trendline theory, you may use this as a supplement theory for better results.
6. I work for my own living, this is a hobby which I do sincerely to help anyone who might come across my charts.
***********************************************************************************************************************************************


vedanta ltd.Hello!! Vedanta is really a very good stock. it is in an uptrend and now a retracement move can be seen it might be of 10 pt.s positionally and then again impulsive move will start hopefully. #my_view #learner


VEDANTA LONG IF CLOSING ABOVE 115VEDANTA LOOKS LIKE IT IS CONSOLIDATING IN A RANGE FOR A PRETTY LONG TIME. THE TRIANGLE PATTERN SUGGEST IT IS READY FOR BREAK OUT. BUT WE NEED A CONFIRMATION FIRST. IF IT CLOSES ABOVE 115 BY THE END OF THE DAY IN ANY TRADING SESSION IT CAN BE LONGED IN FUTURE. EVEN 15 MINUTES, MACD IS SIGNALING A BREAK OUT IN THE STOCK

VEDL BUY ABOVE 112 & SELL BELOW 110ONLY EDUCATION PURPOSE PLEASE TRADE WITH YOUR OWN RISK.
BUY ABOVE 112 IF SUSTAIN
SELL BELOW 110 IF SUSTAIN
PLEASE PROVIDE YOUR VALUABLE FEEDBACK'S FOR BATTER IMPROVEMENT.
THANKS,
SURYA


VEDANTA - On support with Inside Bar - Ascending Triangle#Vedanta is moving under Horizontal channel and now creating the small Ascending Triangle.
Today stock closed above support trendline and created the Inside Bar with 7 day narrow range candle. You can see reversal in tomorrow trend.
Showing Mix result in Technical Parameter:
CCI were trending down but now reversing
RSI were trending down but now reversing
ROC is treading UP
William R% is treading UP
ATR is decresing since 5 day
New Long
----------------------------------------------------------
Support : 105 and 102
Breakdown : 107 (OR Gap down opening)
LTP : 109.10
Breakout : 111.45 (OR GAP UP opening)
Short Target : 114.65 and 120
----------------------------------------------------------
Positive & Negative Point:
1) Bullish in Daily chart
2) Neutral in Weekly Chart
3) Very bearish in monthly chart
----------------------------------------------------------
(Disclaimer: This is only for educational purpose and paper treading.)


VEDL DailyMost Probably will reverse from support based on market conditions.
Disclaimer- All ideas and charts shared by me are strictly opinions shared for educational purpose. Please exercise own caution while dealing with live market. Also I am not a SEBI registered advisor.
