VEDL trade ideas

buy VEDL for 5 years buy vedanta for long trarm / buy and hold for 5-10 years / elliot wave / buy for 3rd wave

Vedanta can be bullishHello friends, There is double bottom pattern 15m and trying to take support on the 1day chart's hot🔥 support zone.
I'm a newbie, please give your opinion and suggest me if there is anything wrong 🙏

VEDANTA Trend AnalysisWill VEDANTA be the next ADANI Enterprises?
Broader outlook says it broke out of the decade long sideways trend and is heading for a retest before a massive upside.
A clear Head & Shoulder pattern is visible in daily timeframe , as per the pattern the technical target is around 190 level which also lies in confluence with trendline support.
Volume shows the participation of strong hands.
Last time strong accumulation happened during Apr 2003-Dec 2005 as highlighted, after that the stock gave a 12X multibagger returns in about 4 years.
Currently we are in a strong accumulation phase when company is diversifying its sector by adding semiconductor and display manufacturing to the commodities only segment.
After this accumulation phase we can expect similar returns in 4-5 years.
As the price is heading towards decade old price territory, here are the key fundamental aspects worth considering:
Sales has increased 13 times,
Operating profit has increased by about 9 times,
Assets have increased by about 27 times,
Cash flow has increased 10 times.
Huge capital is allocated for CAPEX.
For exact figures, kindly refer www.screener.in
Vedanta will finalize a location for its $20 billion semiconductor and display plants in India by this month end and expects to roll out the first chip product in two years, its chairman Anil Agarwal said.
He also said they were manufacturing glass and optical fiber. So, it was natural for them to move into semiconductors.
Taiwan based Foxconn is their technical partner for plant setup and operation.
India's government will extend fiscal support of up to 50% of a project's cost to eligible display and semiconductor fabricators. This will give tailwind to semiconductor sector.
Good time to accumulate is at the retest of trendline support around 190 level.
Long term positional target should be a minimum 10X in 4-5 Years.
Will update the exact targets for short, medium and long term as chart unfolds in future.
Do your own due diligence before taking any action.
Peace!!


VEDL reboundIf VEDL rebounds to recent high level of 385-386, we can expect it to move toward the range of 400-410.

VEDLits looking not well but my point view it turns bullish into bearish for next 15days or it will Breakout if resistance line break

Vedanta Ltd.*Vedanta Ltd.*
Rouding Bottom Formation: Montly Basis
Price/Volume BreakOut. Addtionally, MultiYear Trendline BreakOut.
*With Increase in Price, Trail Stop Loss*
*Book Profit as per Your Risk Appetite*
*Fundamentally Stable Company*
A diversified resources company with interests in Zinclead-silver, oil and gas, aluminum, power, steel, copper, and iron ore. Also one of the largest resources company in India.
Benefits from ownership of low cost, cash rich oil & gas (Cairn)
and zinc-lead-silver (Zinc India) businesses
Increasing Sales / Profitability: Qtrly / Yearly Basis.
Moderate Leverage (Net debt stood at Rs. 27,576cr, with Net Debt-to-EBITDA ratio improving to 0.7x). +ve Cash Flows. Improvement in RoA / RoE / ROCE in FY21 over FY20.
Significant Promoter Holding: Incresed to 69.69% in Dec'21 from 65.18% in Sep'21. Dividend Paying Co.
Considering a potential restructuring of the overall mining operations. May include demerger and listing of its aluminum/iron/steel/oil/ gas businesses as separate standalone entities.
Concern:
Cash allocation.
Fall in commodity prices.
*Do Your Own Research as Well. This is Just an Opinion.*
Your Opinion may Differ and is Respected.
Happy Investing :)

VEDL SWING SETUPVedl Swing Trade Setup
Cmp 387.40
RR - 1:2
Target 420
Safe zone to enter 400++
For educational purpose only .

Give an Opportunity to buy the dip! Parallel channel, An ascending channel is the price action contained between upward sloping parallel lines. Higher highs and higher lows characterize this price pattern.

[High Risk] VEDANTA Looks Strong, heading to 390-450-465 LevelsSWING TRADE
VEDANTA Looks Strong, heading to 390-450-465 Levels
Consult with your financial advisor before investing / do your own research

VEDANAT LOOKING GOODI am Bullish with vedanta
HH HL structure
Higher timeframe bullish
2h chart give breakout

Vedanta BreakoutThe stock has broken out and retested, therefore may undergo a reversal rally. Trade is supported by brokerage calls and Supports Nearby.
Risk Reward Ratio - 2:1
SL is placed below support zone & the lower trendline. The target is placed near resistance.

VEDLNSE:VEDL
Please note that we are not a SEBI Registered Investor Adviser/PMS/ Broking House.
All the contents over here are for educational purposes only and are not investment advice or recommendations
offered to any person(s) with respect to the purchase or sale of the stocks / futures and options.
You are also requested to apply your prudence and consult your advisers in case you choose to act on
any such content available as WE claims no responsibilities for any of your actions or any outcome of
such action
Metals are Shining; Review 14th Feb 2022Please find my review of Metals sector. This is a ongoing review of sector and stock performance.
Regards
AAsta

VEDANTA 20% in 13 dayshi vedanta give 20% in 13 days
may be give more in future
best stock for swing trade
try your luck

Vedantha( VEDL ) Long patternAs per price action analysis, Vedantha broke the daily support. It's a ascending triangle pattern . It already broke out.

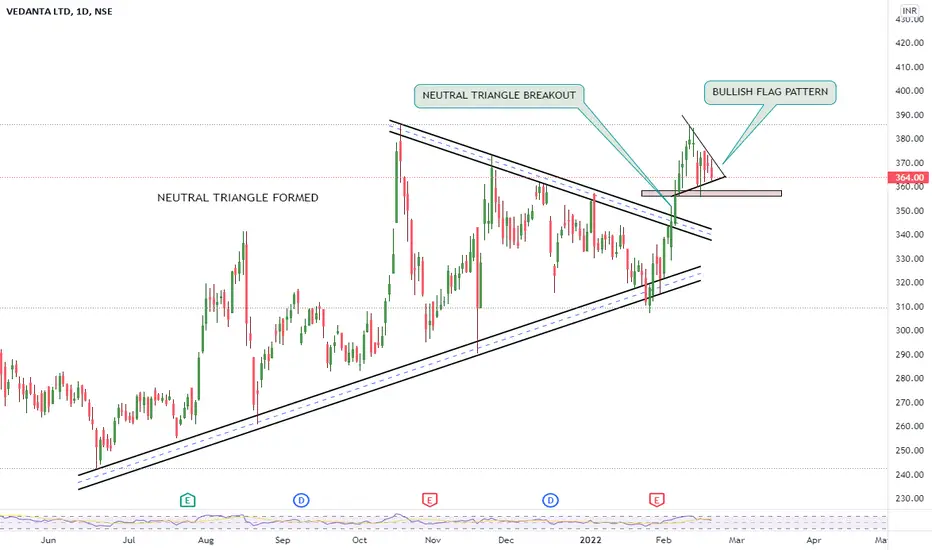
VEDANTA LTD 1:4 PRICE ACTION SETUPNSE:VEDL broke out from a symmetrical triangle pattern after consolidating in it for 4 months.
Bullish signs:
Good breakout volume.
Very few wide range red candles inside the pattern.
Recent support from 30 week EMA.
Strong demand at the trendline indicates the possibility of price going higher.
Scrip has already given a 140% returns in the last year.
Wick on the breakout candle suggest there can be some consolidation before the momentum is released.
One can take a swing trade with a tight stoploss and aim for a 1:4 risk reward setup.
BEWARE, THE PROBABILITY OF THIS TRADE BEING SUCCESFULL IS ENITRELY DEPENDANT ON THE TREND OF NIFTY. IF NIFTY CONTINUES TO BE BEARISH, THE STOP LOSS WILL BE HIT WHETHER IT BE A TIGHT ONE OR A DEEP ONE.
One can just keep this stock on their watchlist instead of entering on the close.
Targets: 400/430/470+
Place tight sl below 330
Position size accordingly if an entry is taken. HAPPY TRADING!

VEDL BUY ABOVE 363, TRAGET +++VEDL BUY FOR SWEING ACCORDING TO ME ITS BUYING OPPORTUNITY ABOVE 363..... do your analysis before buy

vedl buy 333. T 340,350,360looking for buy abouv 333 target 340,245,350,+ do your analylisis before entry

VEDL Good levels on WEEKLY timeframe . Double Bottom , for smaller TF refer linked chart in Comment Section
