33.90 INR
453.15 M INR
6.48 B INR
7.39 M
About VENUS REMEDIES LTD
Sector
Industry
CEO
Ashutosh Jain
Website
Headquarters
Panchkula
Founded
1989
ISIN
INE411B01019
FIGI
BBG000F5NZD4
Venus Remedies Ltd. engages in the manufacture and trade of pharmaceutical products. Its products include analgesic, analgesic and antipyretic, anti diabetic, antibiotic, cardiac, disinfectant and antiseptic, gastro therapy, hand sanitizer, hormone, iron supplement, neurology, oncology, pain management, respiratory, skin care, stress reliever, urology, vitamins/minerals/nutrients, and wound management. The company was founded by Pawan Chaudhary on September 15, 1989 and is headquartered in Panchkula, India.
Related stocks
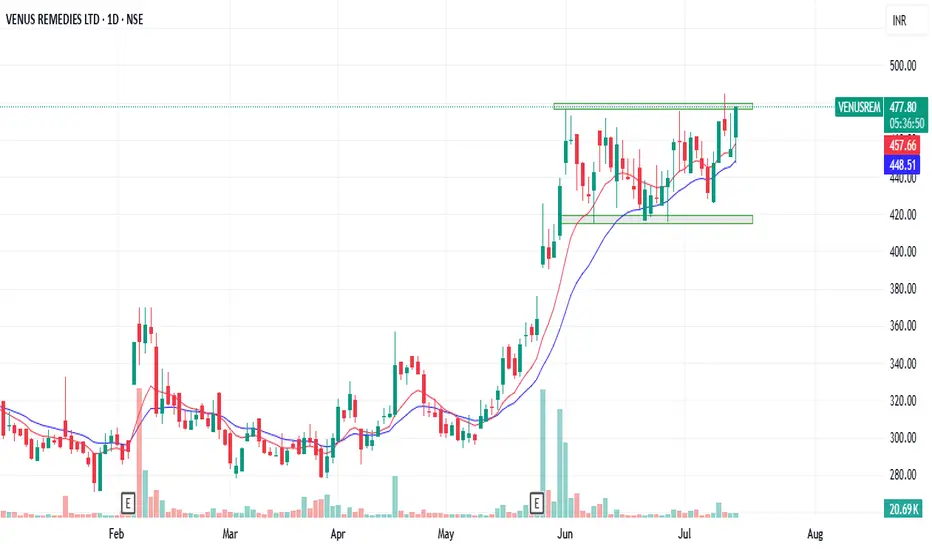
$VENUSREM #INDIA #NSE1. Cup and Handle Break Out.
2. Parallel Channel Break Out.
3.R:R >6 , Tight Stop Loss.
VENUSREM | Buy @LTP or @430 | SL below 333 | 1st Target 700Disclaimer:
This is not financial advice. Please do your own research or consult with a financial advisor before making any investment decisions. Investments in stocks can be risky and may result in loss of capital.

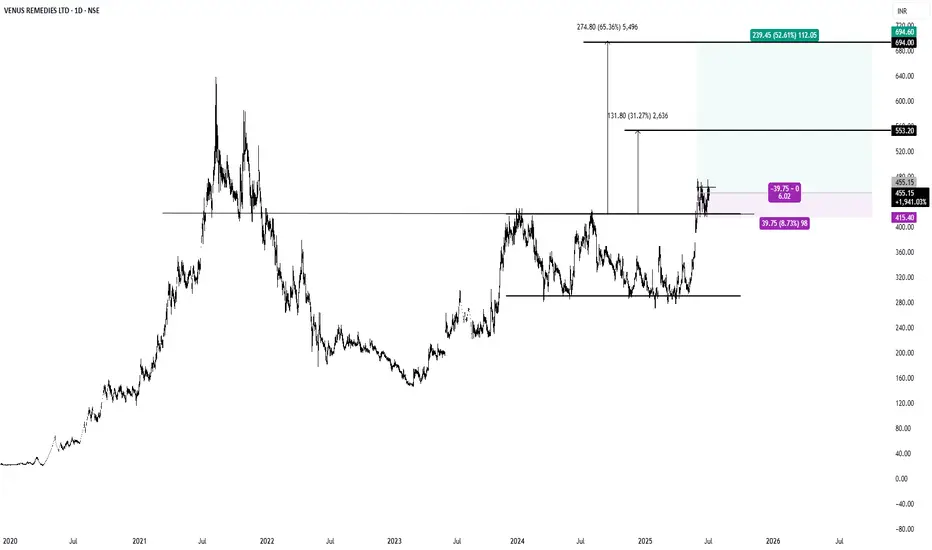
Key Support / Resistance Breakout - Swing TradeDisclaimer: I am not a Sebi registered adviser.
This Idea is publish purely for educational purpose only before investing in any stocks please take advise from your financial adviser.
Key Support & Resistance Breakout. Stock has give Breakout of Resistance level. Keep in watch list. Buy above the h

SWING IDEA - VENUSREMNSE:VENUSREM seems to be freshly coming out of the Cup and Handle Pattern. Co-incidentally, its is also at a Support/Resistance Level of 404.
It can also be noticed that there was a Convergence Divergence at the MACD Crossover a couple of years ago. After which, we see a another good MACD crossove

Venus RemediesLeading Research Based Global Pharm Co.
Market Cap: <350Cr
💥P/B: <1
PE:12X (Sector PE:35X)
Stock rallied 45% in last 6 months

💥Venus Remdies💥-Nice Breakout💥Venus Remdies💥-Nice Breakout
Capital to be deployed- 20k
Investing Price -320-324
Breakout Price-320
Stoploss-225
Targets-451-678
RT for max reach
#venusremedies #StocksToBuy #stocks #StocksToTrade #StocksInFocus #stockstowatch #StocksInNews

Breakout happend in this stock.Breakout happend in this stock and its 40 week moving average (200 day moving average) is also rising.
Keep your risk and reward ratio according to your preferance.
This is for educational purpose. Do your own research before investing.

VENUSREM Long view if Confirmation candle venusrem looks good for channel trading, it has made double/tripple bottom already to form a long view.
can be traded now with candle confirmation using price action.


See all ideas
Summarizing what the indicators are suggesting.
Neutral
SellBuy
Strong sellStrong buy
Strong sellSellNeutralBuyStrong buy
Neutral
SellBuy
Strong sellStrong buy
Strong sellSellNeutralBuyStrong buy
Neutral
SellBuy
Strong sellStrong buy
Strong sellSellNeutralBuyStrong buy
An aggregate view of professional's ratings.
Neutral
SellBuy
Strong sellStrong buy
Strong sellSellNeutralBuyStrong buy
Neutral
SellBuy
Strong sellStrong buy
Strong sellSellNeutralBuyStrong buy
Neutral
SellBuy
Strong sellStrong buy
Strong sellSellNeutralBuyStrong buy
Displays a symbol's price movements over previous years to identify recurring trends.
Frequently Asked Questions
The current price of VENUSREM is 530.00 INR — it has increased by 1.29% in the past 24 hours. Watch VENUS REMEDIES LTD stock price performance more closely on the chart.
Depending on the exchange, the stock ticker may vary. For instance, on NSE exchange VENUS REMEDIES LTD stocks are traded under the ticker VENUSREM.
VENUSREM stock has risen by 4.38% compared to the previous week, the month change is a 16.07% rise, over the last year VENUS REMEDIES LTD has showed a 27.71% increase.
We've gathered analysts' opinions on VENUS REMEDIES LTD future price: according to them, VENUSREM price has a max estimate of 339.00 INR and a min estimate of 339.00 INR. Watch VENUSREM chart and read a more detailed VENUS REMEDIES LTD stock forecast: see what analysts think of VENUS REMEDIES LTD and suggest that you do with its stocks.
VENUSREM reached its all-time high on Aug 9, 2021 with the price of 639.00 INR, and its all-time low was 18.80 INR and was reached on Jul 19, 2019. View more price dynamics on VENUSREM chart.
See other stocks reaching their highest and lowest prices.
See other stocks reaching their highest and lowest prices.
VENUSREM stock is 2.40% volatile and has beta coefficient of 1.00. Track VENUS REMEDIES LTD stock price on the chart and check out the list of the most volatile stocks — is VENUS REMEDIES LTD there?
Today VENUS REMEDIES LTD has the market capitalization of 7.01 B, it has increased by 12.68% over the last week.
Yes, you can track VENUS REMEDIES LTD financials in yearly and quarterly reports right on TradingView.
VENUSREM net income for the last quarter is 210.00 M INR, while the quarter before that showed 196.00 M INR of net income which accounts for 7.14% change. Track more VENUS REMEDIES LTD financial stats to get the full picture.
No, VENUSREM doesn't pay any dividends to its shareholders. But don't worry, we've prepared a list of high-dividend stocks for you.
As of Aug 1, 2025, the company has 1.3 K employees. See our rating of the largest employees — is VENUS REMEDIES LTD on this list?
EBITDA measures a company's operating performance, its growth signifies an improvement in the efficiency of a company. VENUS REMEDIES LTD EBITDA is 635.40 M INR, and current EBITDA margin is 10.18%. See more stats in VENUS REMEDIES LTD financial statements.
Like other stocks, VENUSREM shares are traded on stock exchanges, e.g. Nasdaq, Nyse, Euronext, and the easiest way to buy them is through an online stock broker. To do this, you need to open an account and follow a broker's procedures, then start trading. You can trade VENUS REMEDIES LTD stock right from TradingView charts — choose your broker and connect to your account.
Investing in stocks requires a comprehensive research: you should carefully study all the available data, e.g. company's financials, related news, and its technical analysis. So VENUS REMEDIES LTD technincal analysis shows the buy rating today, and its 1 week rating is buy. Since market conditions are prone to changes, it's worth looking a bit further into the future — according to the 1 month rating VENUS REMEDIES LTD stock shows the buy signal. See more of VENUS REMEDIES LTD technicals for a more comprehensive analysis.
If you're still not sure, try looking for inspiration in our curated watchlists.
If you're still not sure, try looking for inspiration in our curated watchlists.