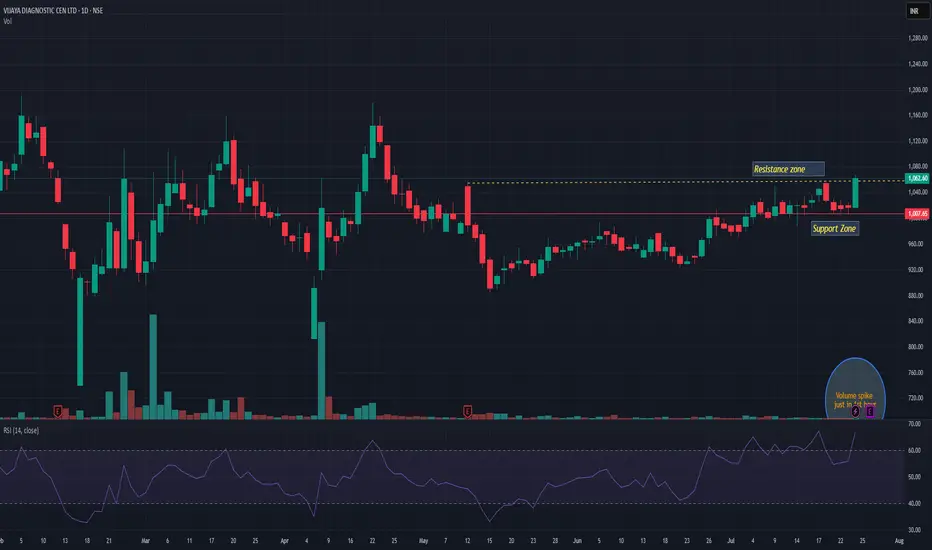
VIJAYAVIJAYA giving trendline breakout with decent volume. Q1 result is on 28th July may push momentum rally. Support seems near 1005 level. We may see momentum up to 1170 in coming days. Keep it on radar.
VIJAYA trade ideas
Darvas Box Strategy - Break out Stock - Swing TradeDisclaimer: I am Not SEBI Registered adviser, please take advise from your financial adviser before investing in any stocks. Idea here shared is for education purpose only.
Stock has given break out. Buy above high. Keep this stock in watch list.
Buy above the High and do not forget to keep stop loss, best suitable for swing trading.
Target and Stop loss Shown on Chart. Risk to Reward Ratio/ Target Ratio 1:2
Stop loss can be Trail when it make new box / Swing.
Be Discipline, because discipline is the key to Success in Stock Market.
Trade what you See Not what you Think.

Vijaya Diagnostics: Rukega Nahi SaalaPrice is at ATH. You can tell this in strong bullish trend even at first glance.
Trend is very strong even if you buy at current ATH 1250 and hold, it can be decent swing trade.
Of course price will make a higher swing low. Maybe best range will be around 1070-1085.
Trend direction - Bullish Confirmed.
Trade direction - Bullish confirmed aligned with long term trend.
Entry : 1070-1085.
SL : 1035 (book half here)
Final SL: 1000 (Exit completely)
Target: Current ATH 1250.
Risk Reward: 1:5
If you can just wait for optimal entry, you reduce your SL risk significantly.
These are types of trades where chart actually invites you to enter, should be never avoided. At least enter with 10qty. You never know compounding effect.
This is what I call high quality trade.
- Clear Trend established with no confusion, even in bearish market
- No sign of exhaustion

VijayaDiagnosticAfter a long consolidation, almost 3+ months, ready to give a good move, price can bee seen to 900, 930, 950, 1000 in upcoming days.
Stock with a good fundamental, FII and DII are heavily invested. could be a portfolio winner.
Happy investing :)

VIJAYA DIANOSTIC CEN LTD S/R Support and Resistance Levels:
Support Levels: These are price points (green line/shade) where a downward trend may be halted due to a concentration of buying interest. Imagine them as a safety net where buyers step in, preventing further decline.
Resistance Levels: Conversely, resistance levels (red line/shade) are where upward trends might stall due to increased selling interest. They act like a ceiling where sellers come in to push prices down.
Breakouts:
Bullish Breakout: When the price moves above resistance, it often indicates strong buying interest and the potential for a continued uptrend. Traders may view this as a signal to buy or hold.
Bearish Breakout: When the price falls below support, it can signal strong selling interest and the potential for a continued downtrend. Traders might see this as a cue to sell or avoid buying.
20 EMA (Exponential Moving Average):
Above 20 EMA(50 EMA): If the stock price is above the 20 EMA, it suggests a potential uptrend or bullish momentum.
Below 20 EMA: If the stock price is below the 20 EMA, it indicates a potential downtrend or bearish momentum.
Trendline: A trendline is a straight line drawn on a chart to represent the general direction of a data point set.
Uptrend Line: Drawn by connecting the lows in an upward trend. Indicates that the price is moving higher over time. Acts as a support level, where prices tend to bounce upward.
Downtrend Line: Drawn by connecting the highs in a downward trend. Indicates that the price is moving lower over time. It acts as a resistance level, where prices tend to drop.
RSI: RSI readings greater than the 70 level are overbought territory, and RSI readings lower than the 30 level are considered oversold territory.
Combining RSI with Support and Resistance:
Support Level: This is a price level where a stock tends to find buying interest, preventing it from falling further. If RSI is showing an oversold condition (below 30) and the price is near or at a strong support level, it could be a good buy signal.
Resistance Level: This is a price level where a stock tends to find selling interest, preventing it from rising further. If RSI is showing an overbought condition (above 70) and the price is near or at a strong resistance level, it could be a signal to sell or short the asset.
Disclaimer:
I am not a SEBI registered. The information provided here is for learning purposes only and should not be interpreted as financial advice. Consider the broader market context and consult with a qualified financial advisor before making investment decisions.


Darvas Box Strategy - Break out StockDisclaimer: I am Not SEBI Register adviser, please take advise from your financial adviser before investing in any stocks.
Stock has given break out buy above the High and do not forget to keep stop loss best suitable for swing trading.
Be Discipline, because discipline is the key to Success in Stock Market.
Trade what you See Not what you Think.

VIJAYA1. Anything can happen.
2. You don't need to know what is going to happen next in order to make money.
3. There is a random distribution between wins and losses for any given set of variables that define an edge. No other thoughts
4. An edge is nothing more than an indication of a higher probability of one thing happening over another.
5. Every moment in the market is unique.

Go long - swing pick- this stock shows signficant delivery percentage value
- possible chances for accumulation
- may perform good in upcoming days
- this stock is picked after market close based on delivery qty data.
- follow this stock for next 5 days , if entry not triggered with in 5 days , ignore pick
- line marked in chart is the day it showed huge delivery percentage.i consider it as signal candle.i marked its high and low
entry
- go long with 1:1.5 RR
- take entry if 15min close crosses the line , ignore entry if it made gap ups
- i prefer entry with in 5 days , if not triggered ignore this pick
sl
- candle close below signal candle's low
target
- keep 1.5 times of sl.

VIJAYA DIAGNOSTIC CENTRE LTD GIVES BRAKEOUT ON WEEKLY CHARTNSE:VIJAYA
Vijaya Diagnostic gives brake out on weekly chart.
Buy 790
Sl 650
Target 1010+
time Duration 2-3 month

VIJAYA - Bullish SetupStock name = Vijaya Diagnostic Center Limited.
Weekly chart setup
Chart is self explanatory. Levels of breakout, possible up-moves (where stock may find resistances) and support (close below which, setup will be invalidated) are clearly defined.
Master Score - B
Disclaimer: This is for demonstration and educational purpose only. this is not buying and selling recommendations. I am not SEBI registered. please consult your financial advisor before taking any trade.

VIJAYA(W)VIJAYA forming a cup and handle chart pattern on the weekly timeframe. Traders watching for potential breakout signals from this bullish pattern. 📈


VIJAYA - Ichimoku BreakoutStock Name - Vijaya Diagnostic Centre Ltd
Ichimoku Cloud Setup :
1). Today's close is above the Conversion Line
2). Future Kumo is Turning Bullish
3). Chikou span is slanting upwards
All these parameters are showing bullishness at Current Market Price
and more bullishness AFTER crossing 675
#This is not Buy and Sell recommendation to any one. This is for education purpose and a helping hand to learn trading in Market.
#CloudTrading
#IchimokuCloud
#IchimokuFollowers
#Ichimokuexpert
I hope you all like my analysis.
Please do share your thoughts into comment section.
Please give a like, share & subscribe for daily analysis.

A clear breakout on weekly and monthly chart together.Very clear breakout on chart Of weekly and monthly, with the relative strength strongness. and ROE,ROCE Quarter to quarter continuous growth showing. RSI both chart is above then 60. Revenue profit. quarterly. by quarterly increase. No doubt. this stock ready to fly.

Almost two year old breakout on monthly and weekly chart Two year awaited Breakout on monthly and weekly chart together with Strong relative. strength, Quarter to quarter total revenue going high,ROE also going quarter to quarter high. RSI in weekly and monthly chart above 60 OBV also strong, it's showing. share have potential to go upward.

💥Vijaya Diagonstic-💥-Nice Breakout💥Vijaya Diagonstic-💥-Nice Breakout
Capital to be deployed- 20k
Investing Price -610-620
Breakout Price-605
Stoploss-493
Targets-774-890
RT for max reach
#vijayadiagonstic #StocksToBuy #stocks #StocksToTrade #StocksInFocus #stockstowatch #StocksInNews

Vijaya Diagnostics Looks good for medium term forming a sort of Inv H&S and retest being done last week but closing below the Gann box levels.
This week could be crucial to find out if it is a fake BO or not.
Safe entry only should be weekly closing above 474

VIJAYA - Ascending parallel channel patternAll details are given on chart. If you like the analyses please do share it with your friends, like and follow me for more such interesting charts.
Disc - Am not a SEBI registered. Please do your own analyses before taking position. This post is only for educational purposes and not a trading recommendation.

1 day chart of vijay diagonistic 1 day chart of vijay diagonistic it is again its major resistance zone 1 day chart of vijay diagonistic it is again its major resistance zone

Vijaya Diagnostic - Positional LongChart set up looks bullish. Double bottom breakout followed by an inverted head and shoulder is in making, chart is making regular higher lows. Buy at CMP and add more on dips, review at 464 and 510. Keep a stop loss below 380 in this positional trade.

VIJAYA DIAGNOSTIC CEN LTD Cup and Handle Pattern Formation*VIJAYA DIAGNOSTIC CEN LTD*
Time Frame: Daily
Observation:
* Cup and Handle Pattern Formation
* Swing High Break
Resistance/Target: 511 559 601 540 672
Support: 395 351 302

vijaya go for long in vijaya . target is next resistance..................................................
