Long-term Continuation PatternGood volume build up in weekly timeframe.
Breakout with good volume.
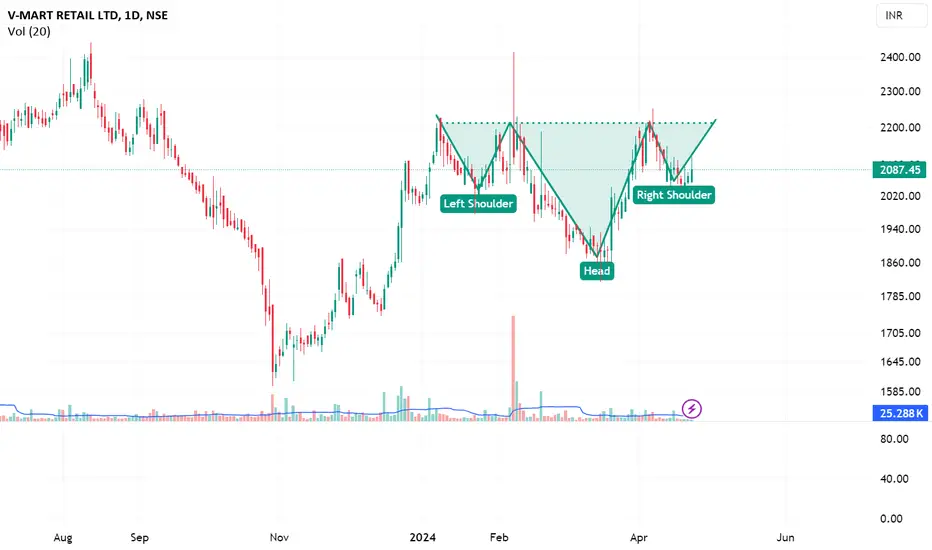
If the breakout fails it will turn into cup and handle pattern. But volume are suggesting other.
Everything depends on boarder markets.
Fundamental's are OK.
FII stakes are up.
Smallcap⚠️⚠️.
NOTE: I do my analysis, do yours before trade.
Eat🍜 Sleep😴 TradingView📈 Repeat 🔁
VMART trade ideas

no fundmental
1. **Price Level 4500 is Crucial for this Stock**
🔵 **4500** is marked as a critical resistance level. Historically, the stock has struggled to break above this mark (indicated by previous points of resistance 1, 2, and 3). Now that the stock has crossed this level, it could indicate a potential breakout or strong upward momentum.
This is marked by the blue line and the annotation above stating that the stock has cleared previous resistances.
2. **Marks 1, 2, 3, and 4 Indicate Resistance Points**
📊 Each of these points (1, 2, 3, 4) shows where the stock faced resistance previously and failed to break above. However, with the recent move, these resistances have been cleared, which might indicate a bullish trend.
- The blue boxes on the chart represent these resistance levels.
3. **Global Markets Not Supporting the Bull Market**
⚠️ **Caution**: The annotation warns that despite the recent positive movement in this stock, global market conditions are currently not favorable for a broad bull market. This implies that external factors might pose risks to further upward movement. Traders should be cautious.
4. **Support at 3896.70 Level**
🔴 The red line near **3896.70** is identified as a potential support level. If the price pulls back, this level could provide a safety net or area of demand where buyers may step in to push the price up again.
Support levels like this are important for managing risk, especially for stop losses or re-entry points.
5. **Volume Spike Indicating a Big Move**
📈 **Volume buildup** is observed over the last month (highlighted near September). This spike in volume is an indication that there is increased interest in the stock, possibly signaling a major move is happening. Higher volume often supports the direction of price movement (in this case, upwards).
6. ** Pattern Formation: Cup and Handle?
☕ There's a suggestion of a **cup and handle** pattern, where the stock's price forms a rounded bottom followed by a consolidation before breaking out. This can be a bullish continuation pattern indicating that the stock might be set for a further upward move after the break
In summary:
The stock has broken above key resistance levels around **4500**.
Volume has been increasing, suggesting interest and a possible big move.
However, global market conditions may not fully support a bull market, so caution is advised.
If the stock pulls back, **3896.70** could be a strong support.
The stock might be forming a bullish pattern (like a cup and handle), but external factors should not be ignored.

VMART - Interesting Price ActionThe chart is self-explanatory as always :)
⚠️Disclaimer: We are not registered advisors. The views expressed here are merely personal opinions. Irrespective of the language used, Nothing mentioned here should be considered as advice or recommendation. Please consult with your financial advisors before making any investment decisions. Like everybody else, we too can be wrong at times ✌🏻

VMARTNSE:VMART
forming Inverted H&S pattern
Rsi is >50
Rsi in buy
Ma is in Buy
above 2200
taget is 2550+
15 minute candle red marabozu Last 15 minute candle form a red marabozu..it means we can take short position on Monday for this stock.target 1% stoploss also 1 %

V mart monthly buying support zonev mart is at buying range in monthly time frame
with 1st immediate target of 2460
can also move forward to 3000 & 3800 levels in coming months
disclaimer :
i am not a sebi registered analyst
this is just for educational purpose
invest wisely as per your risk capacity


VMART vmart making double bottom , and this will give you momentum of 20% from here , risk reward is favorable so accommodate from here (buy at cmp)


Swing trade opportunity in V-MartV-Mart Retail Ltd. engages in the retails of readymade garments and accessories in India.
After making lifetime high of 4848 in Nov 2021, it was in downtrend since then. Now, after 2 years, it has changed its daily and weekly structure from in demand zone and shown potential for upside movement. Also, it has taken support of long-term trendline.
On daily chart, its structure is positive and created a double-bottom pattern on demand area which is bullish chart pattern.
For swing and positional trade, one can create fresh position in V-Mart at CMP and can add more quantity in dip. SL will be the swing low and targets are mentioned on the chart. For positional (long term) targets are very big.
Follow your risk management.
Happy trading :)

Need to Show some StrengthStock has been in negative trend for very long time. Nearing to Pre covid level Support levels.
If broken can see further selling. If taken support at ranges....stock will try to retest trend line channel resistance. If broken might see some furious move.

Vmart Retail NSEHistory repeating itself
T1(Trendline 10) acts as an effective support line for Vmart
Price has touched T1
RSI Convergence Divergence has been formed lately in Daily Chart
Check my daily chart analysis posted on VMART Minds


V Mart IndaSSI Live Trading Series
Sun Storm Investment Trading Desk & NexGen Wealth Management Service Present's
Focus: Worldwide
By Sun Storm Investment Research & NexGen Wealth Management Service
A Profit & Solutions Strategy & Research
Trading | Investment | Stocks | ETF | Mutual Funds | Crypto | Bonds | Options | Dividend | Futures |
USA | Canada | UK | Germany | France | Italy | Rest of Europe | Mexico | India
Disclaimer: Sun Storm Investment and NexGen are not registered financial advisors, so please do your own research before trading & investing anything. This is information is for only research purposes not for actual trading & investing decision.
#debadipb #profitsolutions

Vmart - 2 trades (Momentum + breakout)VMART - currently we are seeing momentum is in play and stock do short term consolidation before 3rd breakout.
if it breaks 3200, we can see long term breakout.
current target of momentum is 3200 and we will visit once it breaks 3200 . momentum trade SL is 2775


V-MART RETAIL LTD- Ready to Long - 4296V-MART LTD- one Buy signle in AI Systems . Buy at 3953, sl at - 3787 1st Target is - 4296. Big Buying movement in this stock in positional basis.

V-Mart 2 Nov 3893 Buy 😃 Ready For !!!!!NSE:VMART
You Can Buy V-Mart On This Base , This Is Very Useful


vmart intraday and swing analysisvmart is very strong bullish
now it is just retesting the vp we can capture some good move with small sl as it has given big move in one candle
previouslly on 15 min tf so now it will try to complete that wick of that candle so keep tracking

BO from TriangleV mart has been having a good run...BO from triangle some days ago but it has been moving up since then..Targets marked. Do your own research.

