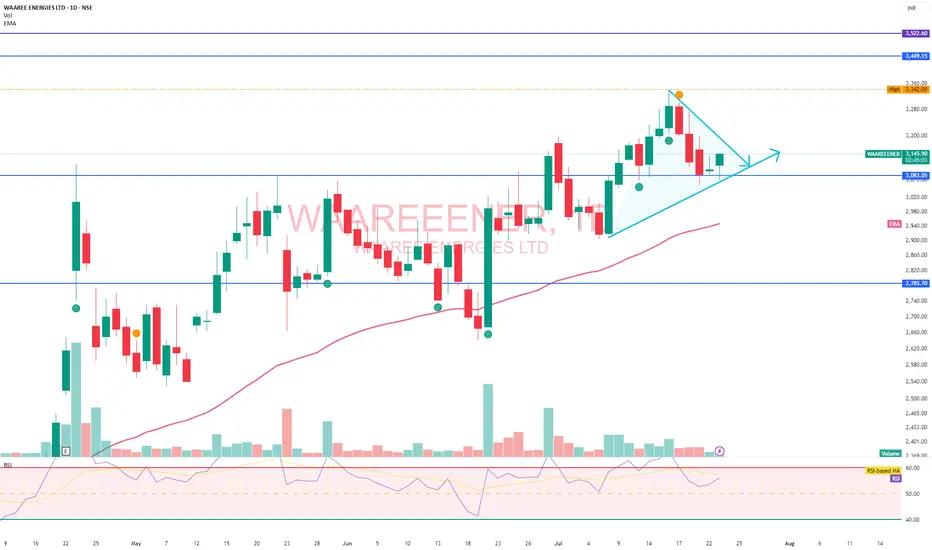
WAAREE ENERGIES LTDWAAREEENER: Looking promising on current market price 3140 around, Follow the SL3083 and wait for short term target 3200, 3250, 3300, 3350
WAAREEENER trade ideas
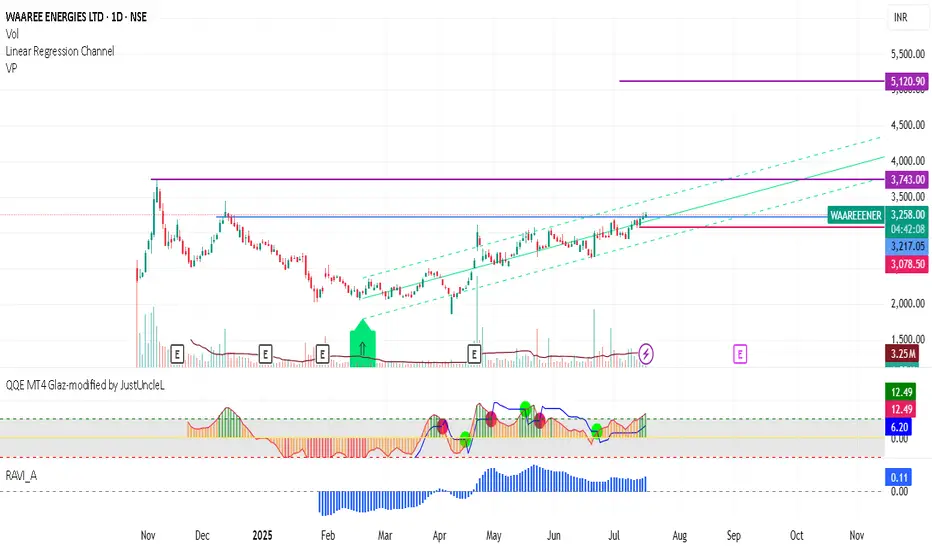
Waaree EnergiesStock crossed above mid of the channel can reach the previous high.
Added into my watchlist.
WAAREE PULLBACKAfter a series of higher lows, now punching above recent resistance ₹3,116 & pulling back slightly which is a typical strong breakout action and sector is linked to renewable energy/equipment; explosive EPS growth backs technical breakout.

WAAREEENER | Risk-Takers Buy @LTP, Safer Entry Above 3120Disclaimer:
This is not financial advice. Please do your own research or consult with a financial advisor before making any investment decisions. Investments in stocks can be risky and may result in loss of capital.

WAAREEENER - Clear VCP in formationPivots marked on charts.
Price above 50 DMA. Volumes are healthy.
Needs one more strong daily candle that closes above the first pivot to mark entry. Positions can be scaled in 33% at a time on breach of each pivot. Hold till HH-HL trend is intact.

Go long in Waaree EnergiesWe can see a formation of cup and handle formation on daily frame. Above 3025 we can see breakout of the stock and from there we can achieve targets of 3125, 3190,3277 & 3350 or all time high also..
stoploss against this investment can be maintain near 2750.

Waaree can easily give 16% return in short time.Block buster result. The stock pop up the next day and now it is down. It can easily go to that level which is 16% return in short time.

WAAREE Energies Ltd view for Intraday 24th April #WAAREEENER WAAREE Energies Ltd view for Intraday 24th April #WAAREEENER
Resistance 3030 Watching above 3036 for upside movement...
Support area 2950 Below 3000 ignoring upside momentum for intraday
Watching below 2948 for downside movement...
Above 3000 ignoring downside move for intraday
Charts for Educational purposes only.
Please follow strict stop loss and risk reward if you follow the level.
Thanks,
V Trade Point

Waaree Energies Ltd (WRTL)🛒 Buy Recommendation
Buy Zone: ₹2,180–₹2,230
The stock is trading close to a support zone near the 23.6% Fib level (₹2,305) and trying to break out of the falling trendline.
RSI has bounced from the oversold region and is near 50, indicating a possible reversal.
🎯 Targets (Short to Medium-Term)
Target 1 – ₹2,585 (38.2% Fibonacci level)
Target 2 – ₹2,810 (50% Fibonacci level)
Target 3 – ₹3,036 (61.8% Fibonacci level – major resistance)
Swing Target – ₹3,766 (100% Fibonacci level – recent high)
🛑 Stop Loss
SL: ₹2,050 (Below recent swing low & below trendline support)
Risk is around ₹180 from entry; ideal for a reward of 1.5x–3x on targets.
🔎 Additional Technical Signals
Volume: Increasing volume on green candles shows buying interest.
RSI: Forming a bullish divergence and heading upward.
Breakout Point: A daily close above ₹2,305 would confirm a breakout of the trendline and strengthen the bullish case.
for educational purposes only

WAAREE Energies Rises After Profit Surge: Is Now the Right Time.Waaree Energies has reported an impressive net profit increase of 295%, totaling ₹492.6 crore, a significant leap that reflects the company's strong performance in the renewable energy sector. The stock trades within a defined range, presenting potential opportunities for investors. The optimal entry point for those considering a purchase would be at the listing day low of ₹2300. Additionally, a secondary entry opportunity may arise around ₹2500, especially if the stock breaks through this level, which has previously served as a notable resistance point. This breakout could indicate positive momentum and further gains for the stock. Investors should watch these price levels closely to maximize their investment strategy.

WAAREE ENERGIES LTD S/RSupport and Resistance Levels:
Support Levels: These are price points (green line/shade) where a downward trend may be halted due to a concentration of buying interest. Imagine them as a safety net where buyers step in, preventing further decline.
Resistance Levels: Conversely, resistance levels (red line/shade) are where upward trends might stall due to increased selling interest. They act like a ceiling where sellers come in to push prices down.
Breakouts:
Bullish Breakout: When the price moves above resistance, it often indicates strong buying interest and the potential for a continued uptrend. Traders may view this as a signal to buy or hold.
Bearish Breakout: When the price falls below support, it can signal strong selling interest and the potential for a continued downtrend. Traders might see this as a cue to sell or avoid buying.
20 EMA (Exponential Moving Average):
Above 20 EMA(50 EMA): If the stock price is above the 20 EMA, it suggests a potential uptrend or bullish momentum.
Below 20 EMA: If the stock price is below the 20 EMA, it indicates a potential downtrend or bearish momentum.
Trendline: A trendline is a straight line drawn on a chart to represent the general direction of a data point set.
Uptrend Line: Drawn by connecting the lows in an upward trend. Indicates that the price is moving higher over time. Acts as a support level, where prices tend to bounce upward.
Downtrend Line: Drawn by connecting the highs in a downward trend. Indicates that the price is moving lower over time. It acts as a resistance level, where prices tend to drop.
Disclaimer:
I am not a SEBI registered. The information provided here is for learning purposes only and should not be interpreted as financial advice. Consider the broader market context and consult with a qualified financial advisor before making investment decisions.

Waaree Energies Forms Symmetrical Triangle: Next Steps...?WAAREE ENERGIES is currently developing a symmetrical triangle pattern on its price chart. This technical formation suggests that the stock is consolidating, with decreasing volatility as it approaches the triangle's apex. At this time, the share price has bounced off the lower trendline of the triangle, which is situated at the 2820 price level. This rebound indicates potential support at that level, suggesting that buyers are entering the market. If WAAREE ENERGIES successfully breaks out above the upper trendline of the triangle, we could possibly see a significant price movement, signaling a bullish trend. Traders should closely monitor key levels and volume as the pattern unfolds to capitalize on any potential breakout.

Waaree Energies buy ideaThe stock is trading in a symmetrical triangle pattern and taken support on lower trendline. One can take this for a target of upper trendline

Waareenergies: cup and handle breakout along with IPO basebreakoIPO base breakout with cup and handle breakout in process.
Please consider stop loss as per capacity and position size.
Disclaimer: only for education purposes, no buy or sell recommendation. we are not sebi registered. always discuss first with your financial advisors

Waree Energies Ltd.*Waree Energies Ltd*
RB Formation on Weekly Basis.
Positive Industry Developments.
Strong growth prospects.
*Trail SL with Upside*
*Book Profit as per Risk Appetite*
*Do your own research as well. This is an Opinion*
*_,Happy Investing_*🤓

WAAREE ENERGIES LTD S/RSupport and Resistance Levels:
Support Levels: These are price points (green line/shade) where a downward trend may be halted due to a concentration of buying interest. Imagine them as a safety net where buyers step in, preventing further decline.
Resistance Levels: Conversely, resistance levels (red line/shade) are where upward trends might stall due to increased selling interest. They act like a ceiling where sellers come in to push prices down.
Breakouts:
Bullish Breakout: When the price moves above resistance, it often indicates strong buying interest and the potential for a continued uptrend. Traders may view this as a signal to buy or hold.
Bearish Breakout: When the price falls below support, it can signal strong selling interest and the potential for a continued downtrend. Traders might see this as a cue to sell or avoid buying.
20 EMA (Exponential Moving Average):
Above 20 EMA(50, 100, 200 EMA): If the stock price is above the 20 EMA, it suggests a potential uptrend or bullish momentum.
Below 20 EMA: If the stock price is below the 20 EMA, it indicates a potential downtrend or bearish momentum.
Trendline: A trendline is a straight line drawn on a chart to represent the general direction of a data point set.
Uptrend Line: Drawn by connecting the lows in an upward trend. Indicates that the price is moving higher over time. Acts as a support level, where prices tend to bounce upward.
Downtrend Line: Drawn by connecting the highs in a downward trend. Indicates that the price is moving lower over time. It acts as a resistance level, where prices tend to drop.
Disclaimer:
I am not a SEBI registered. The information provided here is for learning purposes only and should not be interpreted as financial advice. Consider the broader market context and consult with a qualified financial advisor before making investment decisions.

IN WAAREE MAJOR SUPPORT IS 3050 AND 3000 IS BEST FOR BUY TRENDWAAREE MAJOT SUPPORT IS 3050 U CAN BUY ON THESE LEVEL BEST FOR TODAY IS PRICE IS GO DOWN AND SUPPORT 3050 AND ENJOY THIS RIDE .. Company has a good return on equity (ROE) track record: 3 Years ROE 34.7%

WAAREE ENERGIES - Bullish Momentum in ActionTrade Overview: The bullish setup is unfolding well with TP1 already achieved at 2955.75. Price action is showing strong signs of continuation toward the remaining targets.
Key Levels:
Entry: 2881.85
Stop Loss (SL): 2822.05
Take Profit Targets:
TP2: 3075.35
TP3: 3194.90
TP4: 3268.80
Technical Insight:
The price is trending above the 15-minute moving averages, with a GREEN signal from the Risological Indicator, confirming bullish intent. The breakout beyond TP1 suggests sustained upward pressure.
Traders should watch for any resistance near TP2.
Strategy Tip:
Trail stop loss to lock in profits as the price advances. A pullback toward the entry zone could offer an additional opportunity to strengthen long positions.
Stay tuned for further target hits as Waaree Energies powers through!

In Wareener We can Show here strong Support line support is 2800IN WAaree energy we can show clear support and u can look best advantage to buy and delivery trade to keep in 2 Years for Safe trade

Waaree energies After giving the 60% rally in a week the stock has correct itself more then 50% and how getting at a good zone. breakout over 2990 there can a good swing trade activated

Waaree Energies LtdWaaree Energies is India’s largest manufacturer and exporter of solar modules. As of FY24, they hold 21% share of the domestic market for solar modules and 44% share in India's solar module exports. Its installed capacity surged from 2GW in FY21 to 13.3GW by FY24.

Is This the Right Time to Buy WAAREE ENERGIES...?At the moment, WAAREE ENERGIES is experiencing a pullback to the 3000 rs mark. This price point corresponds with the 0.5 Fibonacci retracement level, which often serves as a significant area of support in technical analysis. As a result, this could be a strategic opportunity for investors to consider making their initial investment.
For those looking to build their position further, it may be prudent to plan for a second investment if the stock price dips to around the 2600 rs level. Keep in mind that this analysis is based solely on technical indicators and does not take into account the fundamental aspects of the company or the market. Therefore, it's crucial to conduct your research and consider all variables before making any investment decisions.

Potential Correction Ahead for Waaree Energies Ltd After Strong Analysis:
1.Price Surge and Overextension: Waaree Energies Ltd has witnessed a sharp upward move, pushing prices significantly higher in a short period. This steep ascent could indicate an overextension, making the stock vulnerable to a pullback or consolidation phase.
2.Resistance Levels:
Immediate resistance is observed around the 3,600 level, with another support/resistance flip level near 3,300. Price nearing these levels might trigger profit-taking or selling pressure from short-term traders.
3.Overbought RSI Indicator: The RSI is currently in overbought territory, signaling an overvalued condition. Historically, an RSI above 70 often suggests a cooling-off period might be near, as buying momentum may slow down.
4.Volume Insights: The recent price rally has been accompanied by high volume, which validates the strength of the trend. However, any decrease in volume while the price stays elevated could indicate waning buying interest, strengthening the case for a correction.
Conclusion: Given the steep rise, overbought RSI, and proximity to resistance, caution is advised. A healthy correction could provide better entry opportunities. Monitor for potential reversal signals and volume changes to gauge the sustainability of this trend.
Trade Idea: Consider waiting for confirmation of a pullback or consolidation before entering new positions. Key support areas for potential retracement include 3,300, 2,625, and 2,280.
