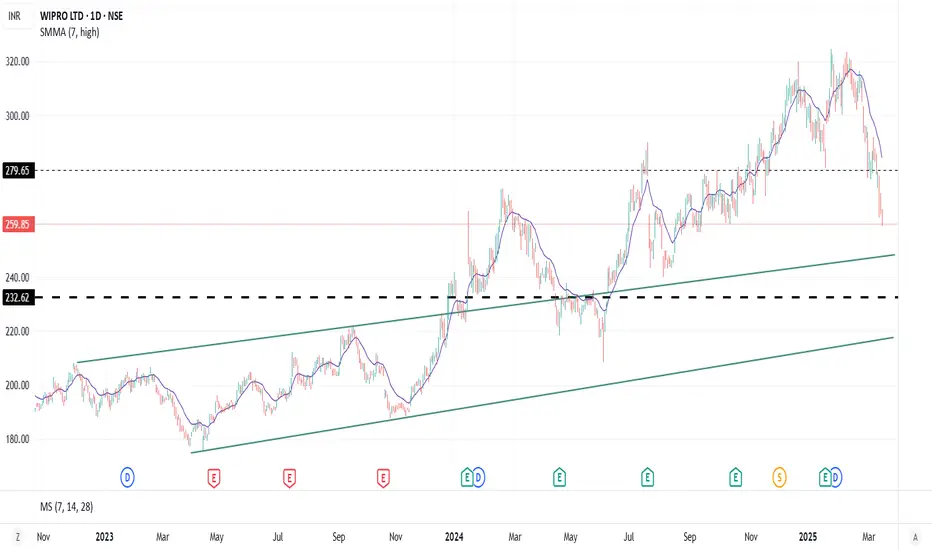
Wipro 259 - Trend DirectionWipro 259 - After a long run, Wipro is getting back to its fair value channel. Breakdown of 278 suggests Wipro to test 213
WIPRO trade ideas
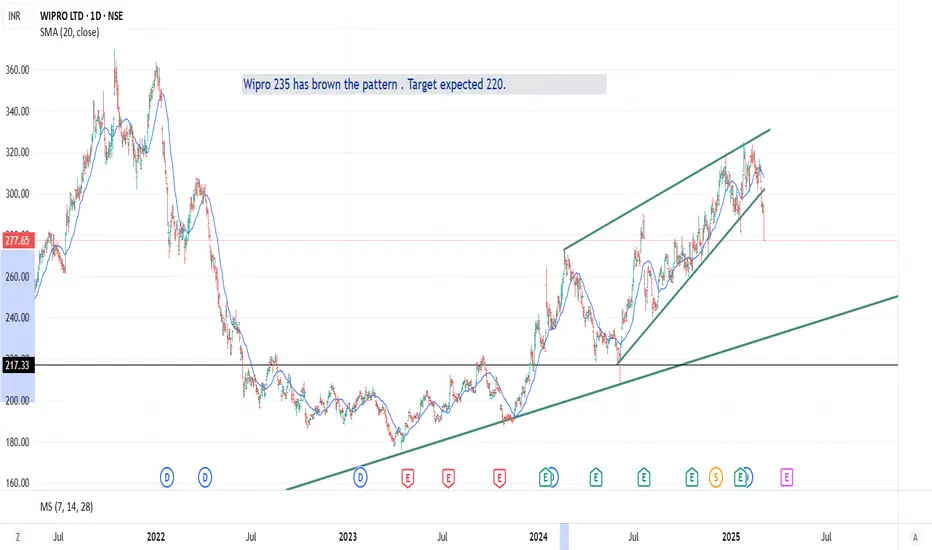
Wipro Trend directionWipro 235 has brown the pattern . Target expected 220.
Will look for buying opportunity around the target with Support2 at 187.
WIPRO | Short FutureDisclaimer:
This is not financial advice. Please do your own research or consult with a financial advisor before making any investment decisions. Investments in stocks can be risky and may result in loss of capital.

Wipro Demand ZoneWipro Demand Zone (DZ) refers to a specific price level or range where Wipro's stock is expected to attract significant buying interest, potentially leading to a price reversal or bounce. This concept is widely used in technical analysis to identify key support levels where traders can look for buying opportunities.

WIPRO- for investment WIPRO- for investment potential 2X stock in an year.
IT stocks will show some good moment in coming year, this could be one of them !!
Buy zone Buy Zone 390 to 440
Investment Targets :- 855, 976 ,1105 may be 1242
Please do your due diligence before trading or investment.
Disclaimer -
I am not a SEBI registered analyst or advisor. I does not represent or endorse the accuracy or reliability of any information, conversation, or content. Stock trading is inherently risky and the users agree to assume complete and full responsibility for the outcomes of all trading decisions that they make, including but not limited to loss of capital. None of these communications should be construed as an offer to buy or sell securities, nor advice to do so. The users understands and acknowledges that there is a very high risk involved in trading securities. By using this information, the user agrees that use of this information is entirely at their own risk.
Thank you.

WIPRO- LONGNSE:WIPRO Weekly rounding bottom ends near 360 zone. Strong Momentum with outperforming market and sector .

Wipro Trend directionWipro 320 - Break out Cup and Handle pattern Is at resistance. Expect to drop down to 280 -275 to retest the breakout.

WIPRO LTD S/R for 21/1/25Support and Resistance Levels:
Support Levels: These are price points (green line/shade) where a downward trend may be halted due to a concentration of buying interest. Imagine them as a safety net where buyers step in, preventing further decline.
Resistance Levels: Conversely, resistance levels (red line/shade) are where upward trends might stall due to increased selling interest. They act like a ceiling where sellers come in to push prices down.
Breakouts:
Bullish Breakout: When the price moves above resistance, it often indicates strong buying interest and the potential for a continued uptrend. Traders may view this as a signal to buy or hold.
Bearish Breakout: When the price falls below support, it can signal strong selling interest and the potential for a continued downtrend. Traders might see this as a cue to sell or avoid buying.
MA Ribbon (EMA 20, EMA 50, EMA 100, EMA 200) :
Above EMA: If the stock price is above the EMA, it suggests a potential uptrend or bullish momentum.
Below EMA: If the stock price is below the EMA, it indicates a potential downtrend or bearish momentum.
Trendline: A trendline is a straight line drawn on a chart to represent the general direction of a data point set.
Uptrend Line: Drawn by connecting the lows in an upward trend. Indicates that the price is moving higher over time. Acts as a support level, where prices tend to bounce upward.
Downtrend Line: Drawn by connecting the highs in a downward trend. Indicates that the price is moving lower over time. It acts as a resistance level, where prices tend to drop.
Disclaimer:
I am not a SEBI registered. The information provided here is for learning purposes only and should not be interpreted as financial advice. Consider the broader market context and consult with a qualified financial advisor before making investment decisions.

wiproindia leading IT company waiting for result , my chart its only for knowledge sharing not for trading purpose

WIPRO READY TO GIVE 30 % UPSIDE MOVEMENTNSE:WIPRO trade at 550 level. You can watch it its till ALL TIME HIGH LEVEL at 720, 30% upside from current price.

Wipro for long term..? RGM EMPIRE Wipro is technically positive for long term.
Wipro chart pattern create head and shoulders pattern in 1d time frame.
It is also positive in monthly time frame.
These share are positive for long term.

Amazing breakout on Weekly Timeframe - WIPROCheckout an amazing breakout happened in the stock in Weekly timeframe, macroscopically seen in Daily timeframe. Having a great favor that the stock might be bullish expecting a staggering returns of minimum 25% TGT. IMPORTANT BREAKOUT LEVELS ARE ALWAYS RESPECTED!
NOTE for learners: Place the breakout levels as per the chart shared and track it yourself to get amazed!!
#No complicated chart patterns
#No big big indicators
#No Excel sheet or number magics
TRADE IDEA: WAIT FOR THE STOCK TO BREAKOUT IN LOWER TIMEFRAME AND RETRACE IF NEEDED. SL IS NEARER SUPPORT ZONE IN Daily TIMEFRAME.
Checkout an amazing breakout happened in the stock in Weekly timeframe.
Breakouts happening in longer timeframe is way more powerful than the breakouts seen in Daily timeframe. You can blindly invest once the weekly candle closes above the breakout line and stay invested forever. Also these stocks breakouts are lifelong predictions, it means technically these breakouts happen giving more returns in the longer runs. Hence, even when the scrip makes a loss of 10% / 20% / 30% / 50%, the stock will regain and turn around. Once they again enter the same breakout level, they will flyyyyyyyyyyyy like a ROCKET if held in the portfolio in the longer run.
Time makes money, GREEDY & EGO will not make money.
Also, magically these breakouts tend to prove that the companies turn around and fundamentally becoming strong. Also the magic happens when more diversification is done in various sectors under various scripts with equal money invested in each N500 scripts.
The real deal is when to purchase and where to purchase the stock. That is where Breakout study comes into play.
LET'S PUMP IN SOME MONEY AND REVOLUTIONIZE THE NATION'S ECONOMY!

WIPRO CMP 558.Gaint multibagger Study on weekly timeframe. Its trading at 52 Week High Zone.Above all Short term,Long term moving everages.Volumes are also gaining.Sign foe a potential uptrend.If it sustain above levels we can see a sharp rally on this counter.Add wachlist and find your best Risk Reward and Entry Exit area thanks.

WIPRO LTD S/RSupport and Resistance Levels:
Support Levels: These are price points (green line/shade) where a downward trend may be halted due to a concentration of buying interest. Imagine them as a safety net where buyers step in, preventing further decline.
Resistance Levels: Conversely, resistance levels (red line/shade) are where upward trends might stall due to increased selling interest. They act like a ceiling where sellers come in to push prices down.
Breakouts:
Bullish Breakout: When the price moves above resistance, it often indicates strong buying interest and the potential for a continued uptrend. Traders may view this as a signal to buy or hold.
Bearish Breakout: When the price falls below support, it can signal strong selling interest and the potential for a continued downtrend. Traders might see this as a cue to sell or avoid buying.
20 EMA (Exponential Moving Average):
Above 20 EMA(50 EMA): If the stock price is above the 20 EMA, it suggests a potential uptrend or bullish momentum.
Below 20 EMA: If the stock price is below the 20 EMA, it indicates a potential downtrend or bearish momentum.
Trendline: A trendline is a straight line drawn on a chart to represent the general direction of a data point set.
Uptrend Line: Drawn by connecting the lows in an upward trend. Indicates that the price is moving higher over time. Acts as a support level, where prices tend to bounce upward.
Downtrend Line: Drawn by connecting the highs in a downward trend. Indicates that the price is moving lower over time. It acts as a resistance level, where prices tend to drop.
RSI: RSI readings greater than the 70 level are overbought territory, and RSI readings lower than the 30 level are considered oversold territory.
Combining RSI with Support and Resistance:
Support Level: This is a price level where a stock tends to find buying interest, preventing it from falling further. If RSI is showing an oversold condition (below 30) and the price is near or at a strong support level, it could be a good buy signal.
Resistance Level: This is a price level where a stock tends to find selling interest, preventing it from rising further. If RSI is showing an overbought condition (above 70) and the price is near or at a strong resistance level, it could be a signal to sell or short the asset.
Disclaimer:
I am not a SEBI registered. The information provided here is for learning purposes only and should not be interpreted as financial advice. Consider the broader market context and consult with a qualified financial advisor before making investment decisions.

SWING IDEA - WIPROWipro , one of India's leading information technology companies, is displaying technical signals that suggest a promising swing trading opportunity.
Reasons are listed below :
550 Zone Breakout : The 550 level has been a significant resistance zone, and the price has recently broken out above this level, indicating strong bullish momentum.
Cup and Handle Pattern Breakout : The price has broken out of a cup and handle pattern, a bullish continuation pattern that suggests potential for further upward movement.
Bullish Breakthrough Candle on Daily Timeframe : The formation of a bullish breakthrough candle on the daily chart indicates strong buying pressure and further supports the bullish case.
Breakout of 2+ Year Consolidation Zone : The stock has broken out of a long consolidation phase lasting over two years, signaling a potential new bullish trend.
Support on 50 and 200 EMA on Weekly Timeframe : The stock is finding support at both the 50-week and 200-week exponential moving averages (EMA), reinforcing the overall bullish sentiment and providing strong support levels.
Target - 640 // 725
Stoploss - weekly close below 490
DISCLAIMER -
Decisions to buy, sell, hold or trade in securities, commodities and other investments involve risk and are best made based on the advice of qualified financial professionals. Any trading in securities or other investments involves a risk of substantial losses. The practice of "Day Trading" involves particularly high risks and can cause you to lose substantial sums of money. Before undertaking any trading program, you should consult a qualified financial professional. Please consider carefully whether such trading is suitable for you in light of your financial condition and ability to bear financial risks. Under no circumstances shall we be liable for any loss or damage you or anyone else incurs as a result of any trading or investment activity that you or anyone else engages in based on any information or material you receive through TradingView or our services.
@visionary.growth.insights

Wipro Ltd. (NSE: WIPRO) - A Technical Analysis PerspectiveIntroduction: In the ever-evolving world of stock trading, staying ahead of market trends is crucial. Today, we delve into the technical analysis of Wipro Ltd. (NSE: WIPRO), a prominent player in the Indian stock market. This analysis will provide insights into the stock's recent performance and potential future movements, making it a must-read for traders and investors alike.
Chart Analysis: The daily chart of Wipro Ltd. reveals a fascinating journey of price action over the past year. The stock has experienced significant fluctuations, marked by distinct patterns and trends that offer valuable insights for traders.
Key Observations:
Ascending Triangle Pattern:
From November 2023 to March 2024, Wipro's stock price formed an ascending triangle pattern. This pattern is characterized by a series of higher lows, indicating increasing buying pressure. The breakout from this pattern in March led to a substantial upward movement, reaching a peak around 580 INR.
Rising Channel:
Post the breakout, the stock entered a rising channel, with higher highs and higher lows. This channel is evident from June 2024 to the present. The upper and lower trendlines of the channel provide crucial support and resistance levels, guiding traders in making informed decisions.
Volume Analysis:
Volume plays a pivotal role in confirming price movements. Notably, there was a significant spike in volume during the breakout in March, validating the upward trend. Recent volume surges in October indicate renewed interest in the stock, potentially signaling another breakout.
Current Price Action:
As of October 21, 2024, Wipro's stock is trading at 550.60 INR, showing a modest gain of 0.36%. The stock is currently testing the upper trendline of the rising channel, a critical juncture that could determine its next move.
Conclusion: Wipro Ltd.'s stock chart presents a compelling case for traders and investors. The ascending triangle breakout, followed by the rising channel, highlights the stock's bullish momentum. With recent volume spikes and the stock testing key resistance levels, it is essential to monitor Wipro closely for potential trading opportunities.
Stay tuned for more updates and insights on the Indian stock market. Follow us for the latest technical analysis and trading strategies!
#NSE #StockMarketIndia #Wipro #TechnicalAnalysis #Trading #Investing


Wipro Monthly (Cup Pattern) Chart RSI above 60 D /W / M,
Moving Averages in line,
support 482,
expected level 729,
Voulme continue

WIPRO LONG Trade Hits First Target! Bullish Momentum BuildsWipro has shown a strong bullish movement, reaching Take Profit 1 (TP1) at 550.85 on 14th October at 12:45 PM.
Key Levels
Entry : 540.80 – Wipro started its upward movement from this key support level, leading to a breakout.
Stop-Loss (SL) : 532.65 – This level is positioned below the entry to protect against any potential downside risk.
Take Profit 1 (TP1) : 550.85 – Already achieved, confirming the strength of the uptrend.
Take Profit 2 (TP2) : 567.10 – The next target to watch as bullish momentum continues.
Take Profit 3 (TP3) : 583.35 – If buying pressure persists, this level could be tested next.
Take Profit 4 (TP4) : 593.40 – The ultimate target signaling the potential for a strong bullish rally.
Trend Analysis
The price is clearly above the support of the Risological dotted trendline, indicating a strong uptrend. The sharp upward movement followed by a small consolidation suggests the possibility of further gains.
With TP1 reached, the next targets are in focus, and a move above 550.85 will likely lead to TP2 being hit.
Wipro has reached its first profit target at 550.85, confirming bullish momentum. The next targets at 567.10 and beyond could be reached if the uptrend holds, with solid support from the Risological trendline and strong buying interest.

WIPRO Swing trading setup & Investment opporunity (overview)WIPRO Swing trading setup & Investment opporunity (overview)
WIPRO is looking strong and creating higher high creation..if sustain above support then upmove will be expected next month

Wipro guves fresh swing breakout Stock - wipro
Setup - swing breakout with good
volume
Trend - positive
Buy for 10% target with strict stoploss of 3-4%
Please consult your advisor before investing..this only for your education purpose
Note- invest your capital in split form not in one time.

Wipro moveWipro looks like ready to unleash big monthly candles from here on.. Keep stop loss near 480-90 levels for a target of 660 740 in coming few months

$wiprowhite line or possibly blue line
where we have decent demand below which is no bueno
heading up to range high by haloween/diwali imho
looking for a scalp
