NIFTYNifty levels are based on imbalances
1. gapup 24700 long
2. 24700-24600 trade breakout
3. gapdown 24600 short
NIFTY1! trade ideas

NIFTYNifty levels are based on imbalances
1. gapup 24770 long
2. 24750-24650 trade breakout
3. gapown 24650 short

NIFTYNifty levels are based on imbalances
1. gapup 24780 long
2. 24780-24650 trade reversal
3. gapdown 24600 short

NIFTYNifty levels are based on imbalances
1. gapup 24730 long
2. 24730-24650 trade breakopuit
3. gapdown 24650 short

The Nifty spot intraday trend forecast for December 09, 2024According to my analysis, On December 09, 2024, the Nifty spot may begin with a Gap up opening and the intraday trend looks bullish till 1.30pm then may likely to take a sideways momentum. The Nifty may close on a bullish note. Technical confirmation is a must and trade with strict Stop-Loss.
The information provided here is only for the educational purposes.

NIFTYNifty levels are based on imbalances
1. gapup 24850 long
2. 24850-24650 trade breakout
3. gapdown 24650 short

Nifty50 Analysis For Coming WeeksWeek Higher Low Entry Confirmed & Daily Invesrted Head & Shoulder Almost Confirmed. I am waiting for Stong bullish Candle in Daily frame... Just for educational Purpose... Hope you people will not going to miss this opportunity...

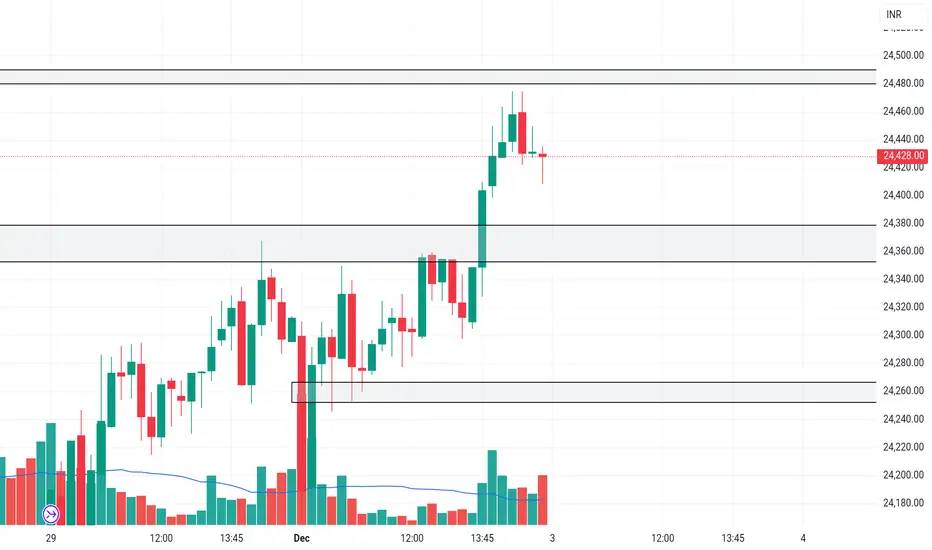
NIFTYNifty levels are based on imbalances
1. gapup 24800 long
2. 24800-24650 trade breakout
3. gapdown 24650 short

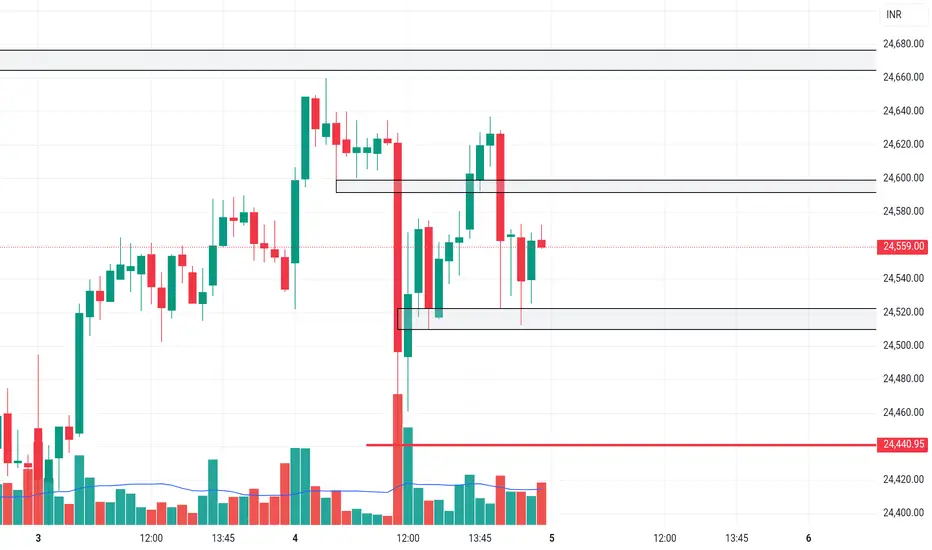
NIFTYNifty levels are based on imbalances
1. gapup 24600 long
2. 24600-24500 trade breakout
3. gapdown 24500 short
NIFTYNIFTY levels are based on imbalances
1. gapup 24600 long
2. 24600-24500 trade breakout
3. gapdown 24500 short

Understanding Trading Psychology and Patience
When trading in the financial markets, particularly with indices like the Nifty50, understanding and managing your trading psychology is as crucial as analyzing charts and price movements. One of the key psychological traits needed in trading is patience, especially when waiting for specific price levels to be hit, such as waiting for the Nifty50 to break a significant Fibonacci level.
1. The Role of Patience in Trading:
Mastering Patience: Patience is not just about waiting; it's about maintaining discipline and not acting impulsively on market noise. In the context of the Nifty50, where traders might be anticipating a breakout above a yellow trendline, patience helps in filtering out false breakouts or minor retracements that could mislead less patient traders.
Avoiding Emotional Decisions: The market can often test your patience with periods of consolidation or slow movement. During these times, fear of missing out (FOMO) or impatience can lead traders to enter trades prematurely or exit profitable positions too early.
2. Fibonacci Levels and Market Timing:
Fibonacci Time Zones: The Fibonacci sequence isn't just applied to price levels but also to time. If traders are expecting the Nifty50 to break a resistance (the yellow line in your scenario) within a Fibonacci time frame, like between 1.682 to 2 levels, this anticipation requires a deep understanding of the market's rhythm. This level of prediction involves patience because these time zones might not align perfectly with market actions, requiring traders to stay calm and wait for the market to validate their analysis.
3. Psychological Strategies for Staying Patient:
Embrace the Waiting Game: Realize that market movements often need time to unfold. Traders should use this waiting period to refine their strategies, review historical data, or simply disconnect to avoid overreacting to every minor fluctuation.
Use of Technology: Employ alerts or automated systems that can notify you when the Nifty50 reaches your predicted Fibonacci levels. This reduces the constant need to monitor the market, helping to maintain patience.
Journaling: Keep a trading journal where you note not only your trades but also your emotional state during different market conditions. Reflecting on these can teach you about your patience thresholds and how to extend them.
Visualization and Mental Rehearsal: Imagine different scenarios where the Nifty50 breaks the yellow line. How would you react? Mental rehearsal can prepare you for real-time decision-making, reducing anxiety and impatience.
4. Practical Steps:
Set Clear Expectations: Before the market even approaches your Fibonacci levels, have a clear plan. Know your entry points, stop losses, and what you're willing to wait for. This preparation minimizes second-guessing during the actual event.
Stay Informed, Not Overwhelmed: Keep abreast of news that could affect the Nifty50, but avoid getting caught up in every piece of information. This balance keeps you informed enough to be patient for significant moves.
Learn from Each Cycle: Whether the anticipation of breaking the yellow line proves correct or not, there's a lesson in patience. Each market cycle teaches traders about timing, patience, and the psychological endurance needed for trading.
By integrating these psychological insights with technical analysis like Fibonacci levels, traders can better prepare for moments like waiting for the Nifty50 to break a significant resistance, fostering a disciplined approach that mitigates emotional trading decisions. Remember, in trading, sometimes the best action is to take no action at all until conditions are just right.

NIFTYNIFTY levels are based opn imbalances
1. gapup 24500 long
2. 24500-24350 trade breakout
3. gapdown 24350 short
Technical Analysis of S&P CNX Nifty Index Futures (15-Min Chart)The chart highlights a consolidation phase near a resistance zone after a bullish move from lower levels. Below is a detailed analysis, including the bullish and bearish scenarios, with potential entry and exit points.
Key Observations
Trend Overview:
The price has been consolidating near the 24,376–24,400 resistance zone after a sharp uptrend.
A clear breakout above this resistance could confirm further bullish momentum, while rejection at this level may signal a pullback.
Support Levels:
24,164–24,190: Key support zone (aligned with NY Midnight Open at 24,191.2), providing short-term buying interest.
23,608–23,650: Major demand zone where the prior uptrend originated, acting as a strong support level.
Resistance Levels:
24,376–24,400: Immediate resistance zone, with visible selling pressure.
24,568–24,600: Secondary resistance zone and potential breakout target.
24,724–24,750: Major resistance area, marking the extended bullish target.
Volume Analysis:
High Sell Volume (512.65K): Indicates significant selling pressure near 24,376, confirming this as a key resistance level.
Buy-side interest remains active near 24,190, preventing a deeper correction so far.
Bullish Scenario
Conditions for a Bullish Move:
Price must break above 24,400 with strong volume, confirming a breakout of the resistance zone.
Sustained buying pressure would push the price toward higher resistance levels.
Entry Points:
Aggressive Entry: Buy near the 24,164–24,190 support zone, with a stop-loss below 24,150.
Conservative Entry: Buy on a confirmed breakout and retest above 24,400, with a stop-loss below 24,350.
Exit Points (Take Profit):
First Target: $24,568–$24,600 (secondary resistance zone).
Second Target: $24,724–$24,750 (major resistance and extended target).
Invalidation:
A breakdown below 24,150 would invalidate the bullish setup.
Bearish Scenario
Conditions for a Bearish Move:
Price fails to break above 24,400, indicating strong selling pressure.
A confirmed breakdown below 24,164 would open the path for further downside.
Entry Points:
Aggressive Entry: Short near the 24,376–24,400 resistance zone if rejection is visible, with a stop-loss above 24,420.
Conservative Entry: Short after a confirmed breakdown below 24,164, with a stop-loss above 24,200.
Exit Points (Take Profit):
First Target: $24,000 (psychological support level).
Second Target: $23,650–$23,608 (major demand zone and strong support).
Invalidation:
A breakout above 24,420 would signal potential bullish continuation.
Key Indicators to Monitor
Volume Behavior:
Watch for increased buying volume near 24,190, supporting the bullish case.
Sustained selling volume near 24,400 would confirm bearish rejection.
Breakout Levels:
A breakout above 24,400 could trigger bullish momentum toward 24,568 or higher.
A breakdown below 24,164 signals a bearish move targeting lower levels.
Market Sentiment:
The consolidation phase suggests indecision; a breakout or breakdown will clarify the direction.
Summary of Probable Entry & Exit Points
Scenario Entry Zone Stop-Loss Target Levels
Bullish $24,164–$24,190 (Aggressive) or above $24,400 (Conservative) $24,150 $24,568, $24,724
Bearish $24,376–$24,400 (Aggressive) or below $24,164 (Conservative) $24,420 $24,000, $23,608
Conclusion
Bullish Outlook: A breakout above 24,400 can lead to a rally toward 24,568 and potentially 24,724.
Bearish Outlook: A failure to break 24,400 or a breakdown below 24,164 may lead to declines toward 24,000 or 23,608.
Traders should monitor the price action around 24,400 and 24,164 to identify the next significant move, while using tight stop-losses to manage risk.

NIFTYNIFTY levels are based on imbalances
1. gapup 24380 long
2. 24380-24240 trade brteakout
3./ gapdown 24240 short
NIFTYNIFTY levels are based on imbalances
1. gapup 24050 long
2. 24050-23800 trade breakout
3. gapdown 23800 short

Day Trading Nifty-28th Nov ’24 Below mentioned points are discussed in my post analysis video(Fast forward to 3:02 for Hindi Audio)
-No trades in the morning
-No Volumes in the morning before 10
-Sold & Bought Nifty

NIFTYNIFTY levels are based on imbalances
1. gapup 24380 long
2. 24380-24240 trade reversal
3. gapdown 24240 short

Day Trading Nifty-27th Nov ’24Below mentioned points are discussed in my post analysis video
-No trades in the morning
-No Volumes in the morning before 10
-Bought Banknifty Near Lows

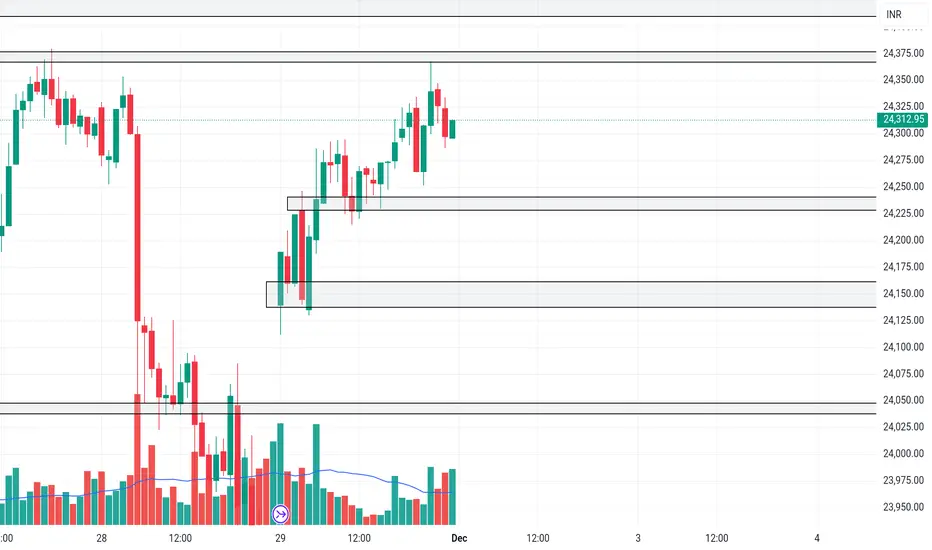
NIFTYNIFTY levels are based on imbalances
1. gapup 24350 long
2. 24350=-24150 trade breakout
3. gapdown 24150 short
Day Trading Nifty-26th Nov ’24 (Hindi Audio-0:48)Below mentioned points are discussed in my post analysis video(Fast forward to 0:48 for Hindi Audio)
-No trades in the morning
-No Volumes in the morning before 10
-Bought Nifty Near Lows-SL hit

Plan for 26th November 2024Nifty future and banknifty future analysis and intraday plan.
This video is for information/education purpose only. you are 100% responsible for any actions you take by reading/viewing this post.
please consult your financial advisor before taking any action.
----Vinaykumar hiremath, CMT

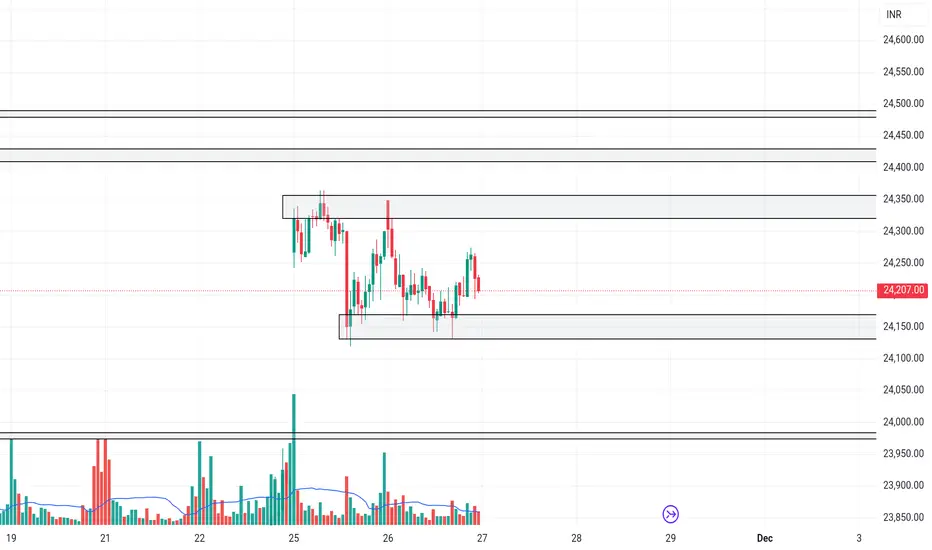
NIFTYNIFTY levels are based on imbalances
1. gapup 24340 long
2. 24340-24220 trade breakout
3. gapdown 24220 short

Day Trading Nifty-25th Nov ’24 Below mentioned points are discussed in my post analysis video(Fast forward to 1:08 for Hindi Audio)
-No trades in the morning
-No Volumes in the morning before 10
-Bought Nifty around Highs & Lows.Bad Sl!
