SCOM trade ideas
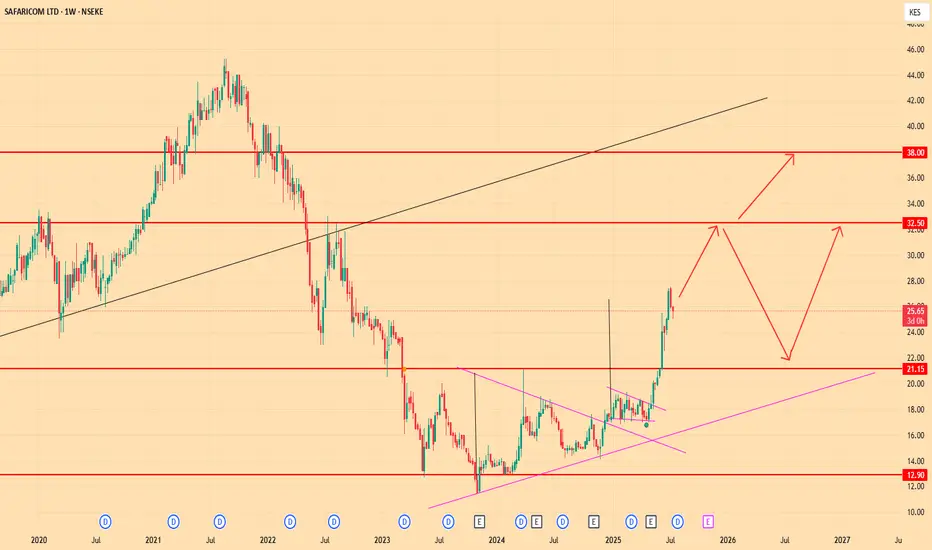
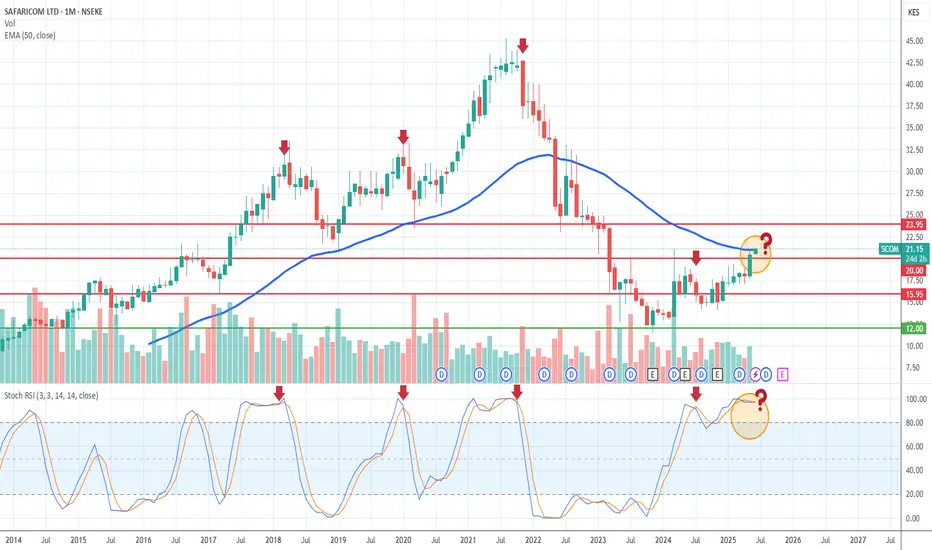
SAFARICOMOn the monthly chart, the Safaricom stock price is facing multiple technical resistance. Kes 20.00 is a critical psychological number to Kenyan traders, and this is evident with the convergence of technical indicators around this price.
If the stock price trades above Kes 22 on the weekly chart, the stock price will confirm a long-term breakout. If not, technical resistance will keep the price below Kes 20.00 in the short term.

Safaricom stock froming a correctionIntroduction
Investors in Safaricom, one of Kenya's leading telecommunications companies, are currently witnessing a correction phase in the stock's price. This correction is a natural part of market dynamics and often provides opportunities for strategic investment moves. Furthermore, technical analysis suggests that following this correction, Safaricom's stock may experience an impulse downwards, with a projected target price of around 13.5 Kenyan Shillings (KES).
Correction Phase
A correction in the stock market refers to a temporary reverse movement in the price of a stock, usually against the prevailing trend. In the case of Safaricom, this correction may be attributed to various factors, including profit-taking by investors who had previously bought the stock at lower prices, changes in market sentiment, or broader economic factors affecting the telecommunications industry.
Despite the short-term dip in prices, corrections are often considered healthy for the long-term stability of a stock. They help to realign the market by shaking out excessive speculation and restoring equilibrium between supply and demand. During this correction phase, investors may view it as an opportunity to reassess their positions or even accumulate more shares at relatively lower prices.
Impulse Phase
Following the correction, technical analysis suggests that Safaricom's stock is likely to enter an impulse phase. An impulse is a rapid and significant movement in the price of a stock, typically in the direction of the prevailing trend. In this case, the impulse is anticipated to be bullish, indicating a potential upward movement in Safaricom's stock price.
The projected target price of around 13.5 KES indicates the level at which the impulse phase may culminate. This target is derived from various technical indicators, such as trend lines, moving averages, and chart patterns, which suggest strong buying pressure and positive sentiment among investors.
Investment Considerations
For investors considering entering or exiting positions in Safaricom's stock, it's essential to carefully evaluate the current market conditions, as well as their own investment goals and risk tolerance. While corrections and impulses provide opportunities for profit, they also carry inherent risks, including market volatility and unexpected events.
Additionally, investors should conduct thorough research on Safaricom as a company, including its financial performance, competitive position, and growth prospects. Fundamental analysis, coupled with technical indicators, can help investors make informed decisions about the timing and direction of their trades.
In conclusion, while Safaricom's stock may currently be undergoing a correction phase, investors should remain vigilant and monitor market developments closely. By staying informed and employing sound investment strategies, investors can navigate market fluctuations and capitalize on potential opportunities presented by the correction and subsequent impulse phases.

Volume candles and how they can be used to make trade decisionsHello,
Volume candlesticks are a very unique dataset that give us more information than the candlesticks we are used to. First, a candlestick is a type of price chart used in technical analysis that displays the high, low, open, and closing prices of a security for a specific period. Now with the Volume candlesticks, they are a type of chart that allows for a visual assessment of the volume of trades for each candle. These are still candlesticks, but the width of each candle depends on the volume of trades during the period of formation of this candle. The greater the trading volume during the formation period of the candle, the larger the width of the candle.
What does a candlestick say?
A candlestick will tell you what the market is doing and especially what the big traders are doing. Different candlesticks would tell you different situations in the market. Now let us look at classical examples using the charts herein. We will combine our knowledge on both the candlesticks and Volume candlesticks that is now available on Tradingview.
From our chart above all these small candlesticks tell us that the stock is in a correction. A correction is a situation where the market is moving in a sideways movement. Trading corrections are very difficult for most traders and it is advisable to avoid them if you have no or little trading experience. All the candles in our above zone also do not have substantial width or length telling you that the volumes traded during corrections are usually low and hence the reason why markets rarely move during such times.
understanding types of candles and their meaning
It is easy to note that the volumes began coming at the bottom. This can be seen on this chart
This is where the width of the candles began becoming bigger. This is a great significance that it's time to begin thinking of buying this stock since it was correcting and in an upward trend. The width kept becoming bigger and price kept moving upwards.
At the top after the candle closed the thinnest, it is easy to conclude that the volumes have now dried up and therefore the beginning of a bigger correction is coming. This is a great time for you now to take your profits and focus on the next trade as you await the bigger correction to complete.
We shall keep you updated when we see volumes return on this stock. This strategy coupled with technical analysis, fundamental analysis and market data is very strong in the trading cycle.
All the best

Safaricom setting up for reversalHello,
Divergence clear on this stock signalling we might be close to the bottom. Divergence in stocks refers to a situation where the price of a particular stock or index moves in a different direction than an indicator or another related stock or index. It indicates a potential shift in market sentiment or investor behavior, creating a disparity between the expected and observed trends. Divergence can occur in various forms, such as price-oscillator divergence or intermarket divergence, and is often considered a signal of a possible reversal or correction in the stock's price trajectory. Traders and investors closely monitor divergence patterns as they can provide valuable insights into market dynamics and aid in making informed decisions.

Using price action & tradingview tools to trade betterHello,
Price action is a vital aspect of trading, and analyzing candlestick patterns is key to understanding market dynamics. The size of candles, representing the range between opening and closing prices, is crucial for traders. Large candles signal strong momentum and potential trends, while smaller candles suggest indecision or lack of clear direction. Traders use candle size to identify entry and exit points, manage risk, and gauge market sentiment. By examining the relationship between candle sizes and volume, traders can make informed decisions based on visual representations of price movements. In summary, candle size is a valuable tool in price action analysis, helping traders interpret market behavior for better decision-making.
A key tool you can use to measure the momentum of an asset is the Date & price range tool . This tool allows users to place points vertically on two different prices. A Text appears along the box displaying the total size of the price moving in terms of actual share price, percentage and time the move took. E.g the chart below shows the move took 3234 days and was +1024.43% in terms of increase.
Once you've got the hang of price action and figured out which way the trend is going, the next big thing is spotting patterns that tell you when to jump in. We focus on two things: motive moves, which show the trend, and corrections, which give us good entry points . Motive moves are like the big, important moves we want to trade, and corrections are where we can get in on the action. Recognizing these patterns helps us know when it's smart to join the market and increases our chances of making successful trades. a good example of these can be identified below
Once you've identified patterns, the next step is deciding when to get in. There are two main types: risk entries and risk-averse entries. Risk entries often align with motive moves, indicating a trader's willingness to take on more risk for potentially higher rewards. Below is a great way of looking at both of this
Risk taking entry
Risk averse entry
This is where the correction has already been broken and a trend determined. The Risk to reward ratio is lower and therefore less profit can be achieved here.
Next we shall be looking at how to look at the indicators to support your trading hypothesis and make better trades.
Good luck and all the best.

Is Kes 8 a possibility? Safaricom had the worst two years in its history but there are opportunities for a long-term investor. We did not have Safaricom in our portfolio because it was too expensive from our point of view. And the dividend growth was not attractive to us.
From a capital gains perspective, the stock has a lot of potential and we are anticipating that it will drop to Kes 13 in December/Jan/Feb due to fundamental factors. And maybe break lower into the accumulation zone.
We will wait and see how the stock plays out.


SAFARICOM ANALYSISThe Kenyan based company has fallen from grace in just 22 Months, wiping out almost 80% of its 10 year bull run. The market is approaching previous support, where it reversed before. The giant Telco enjoys monopoly in the country, with a huge customer base, mainly attributed to its money transfer service, MPESA. Recently, the company launched operations in Ethiopia. More downside for Safaricom may be limited for now, and what we are most likely to see is a extended period of consolidation as the market absorbs the recent selling pressure before we see the next bull run.

Unlock the Secrets of Doji, Hammer and Dragonfly DojiHello,
Candlesticks have been there longer than most of us can imagine. They are a unique way of looking at things because they normally have four price points. Candlestick patterns are formed by the combination of one or more candlesticks, which are graphical representations of the price action of a financial asset during a particular time period.
Doji, hammer, and dragonfly doji are three common candlestick patterns that traders use to identify potential trend reversals or continuation.
A doji is a candlestick pattern that forms when the opening and closing prices of an asset are nearly identical. This results in a candlestick with a very small body and long wicks on both ends. A doji indicates indecision in the market and suggests that buyers and sellers are evenly matched, which can lead to a potential reversal in trend.
A hammer is a bullish reversal pattern that forms at the bottom of a downtrend. It consists of a small body with a long lower wick and little to no upper wick. A hammer indicates that sellers have pushed the price down but buyers have stepped in and pushed the price back up, suggesting a potential reversal in trend.
A dragonfly doji is a candlestick pattern that forms when the opening and closing prices are at or near the high of the day, with a long lower wick and no upper wick. It resembles a hanging man pattern but is considered bullish rather than bearish. A dragonfly doji indicates that sellers have pushed the price down but buyers have stepped in and pushed it back up, suggesting a potential reversal in trend.
When looking at the doji, hammer, and dragonfly doji candlesticks, traders often analyze the price action surrounding these patterns. For example, if a doji forms after a strong uptrend, it may indicate that the buyers are losing momentum and a reversal could be imminent. Conversely, a hammer or dragonfly doji forming at the bottom of a downtrend may suggest that buyers are stepping in and a trend reversal could be on the horizon. Traders use these patterns in combination with other technical indicators to gain insight into the market and make informed trading decisions.
These key candles will be very key in determining the direction of our next move on any asset class analysis.

Safaricom shares prices dropping close to a demand levelSafaricom share price is at a significant level?
Currently Safcom share see real time value www.safaricom.co.ke
Is this valuation ideal and thus a good average for Safaricom
or
Do you think the current valuation for safaricom is premium price (overpriced).
The third option, current safaricom price is at discount levels (Under valued?)..
Bear this in mind when deciding.
Safaricom is extending it's services to the Democratic Republic of Congo (DRC). A country considered the world's richest country in terms of wealth in natural resources. In DRC most of the raw mineral deposits remain untapped and are worth an estimated $24 trillion.
Safaricom is the most dominant communication and financial company in East and Central AFRICA. Safaricom-MPESA, is so popular the government of Kenya owns 35% of Safaricom, which converted into a public company in the year 2002.
Also note about 5 years ago, Southern African telecoms giant Vodacom Group bought 35% stake in Kenyan operator Safaricom.
By the way I analyse my charts analysing Stocks, Forex indices and cryptocurrency (candlesticks) using trading view, free app to use globally www.tradingview.com
Some questions to help the young ones start considering and investing time and consider becoming investors and not just end users.
Few questions and if any of the questions here is yes, please make sure you speak to a person who has ever bought safaricom shares.
Quiz 1
Would you like to own safaricom shares?
Quiz 2
Who uses safaricom products?
Quiz 3
Who has ever bought safaricom shares? what price did you buy
Quiz 4
Does anyone here own any safaricom shares?

Using different tools to make your analysis easierHello,
Tradingview gives you tools you will never find in any platform. The tools are very key in making you a better trader. Below are my favourite tools
1:arrow: This tool is very key because t helps me set and indicate my targets clearly
2:Trendline: This is the yellow line on my chart that helps me identify the charts and make them clear for everyone
3: date & price range tool: This tool is very key to my analysis because it shows me the increase/decrease in percentage terms while it also shows me how many days/hrs it took for that move to happen.
Good luck in your journey!

SCOM buyI see an imbalance at around ksh 19 and if its hit and takes out the trendline then it's a good buy and hold opportunity.
