CSE All Share Price Index (ASPI): Continuation of Good Momentum
Title:
CSE All Share Price Index (ASPI): Continuation of Good Momentum
Greetings, Traders!
🌟 Hello everyone,
The CSE All Share Price Index (ASPI) continues to exhibit strong momentum, indicating favorable trading conditions in the market.
$CSE_ASPI
Key Observations:
- The ASPI demonstrates sustained momentum, reflecting positive market sentiment and robust buying interest.
- Traders are closely monitoring the index's behavior, seeking potential opportunities to capitalize on the ongoing bullish trend.
- The current momentum in the ASPI may present favorable conditions for both short-term and long-term trading strategies.
Technical Analysis:
Technical analysis of the ASPI's price chart confirms the presence of a strong bullish trend, with price action consistently making higher highs and higher lows. Technical indicators support the continuation of the bullish momentum.
Fundamental Factors:
In addition to technical analysis, fundamental factors such as economic indicators, corporate earnings, and government policies contribute to the ASPI's movement. Traders should remain vigilant to changes in these factors.
Trading Strategies:
Given the favorable momentum in the ASPI, traders may consider adopting trend-following strategies, such as buying on pullbacks or breakouts, to capitalize on the upward movement. Risk management is essential to safeguard against potential reversals.
In Conclusion:
With the ASPI demonstrating strong momentum, traders have the opportunity to explore various trading strategies aligned with the prevailing trend. However, it's crucial to remain disciplined and adhere to risk management principles in all trades.
Engage with Us:
🟢 If you find this analysis insightful, please give it a LIKE.
🟡 Don't forget to FOLLOW for more updates.
🔵 SHARE with fellow traders who might benefit from this information.
🔴 Feel free to COMMENT with your thoughts and insights!
Your active participation enriches our trading community, fostering knowledge exchange and collective growth. Share your feedback and ideas in the comments below or by boosting this post.
Looking forward to connecting with you in the next post.
Happy trading!
ASI trade ideas

ASI Weekly Chart Update - 07/03/2024ASI touched 11000 level after few weeks. This is a critical level and it needs to close upper trend line in this triangle pattern.
Disclaimer: The information and analysis provided in this publication are for educational purposes only and should not be construed as financial advice or recommendations to buy, sell, or hold any securities. The author and TradingView are not responsible for any investment decisions made based on the content presented herein. Always consult a financial professional before making any investment decisions.

CSE - Monthly ChartCriteria for another Bull market in Stock market of Sri lanka
1. Need to close few more Green candles above 9150 in monthly chart & It should protect 21 EMA in monthly chart
2. RSI should be more than 50 in monthly chart
3. Finally monthly candles should break strong resistance level 10650
Disclaimer: The information and analysis provided in this publication are for educational purposes only and should not be construed as financial advice or recommendations to buy, sell, or hold any securities. The author and TradingView are not responsible for any investment decisions made based on the content presented herein. Always consult a financial professional before making any investment decisions.

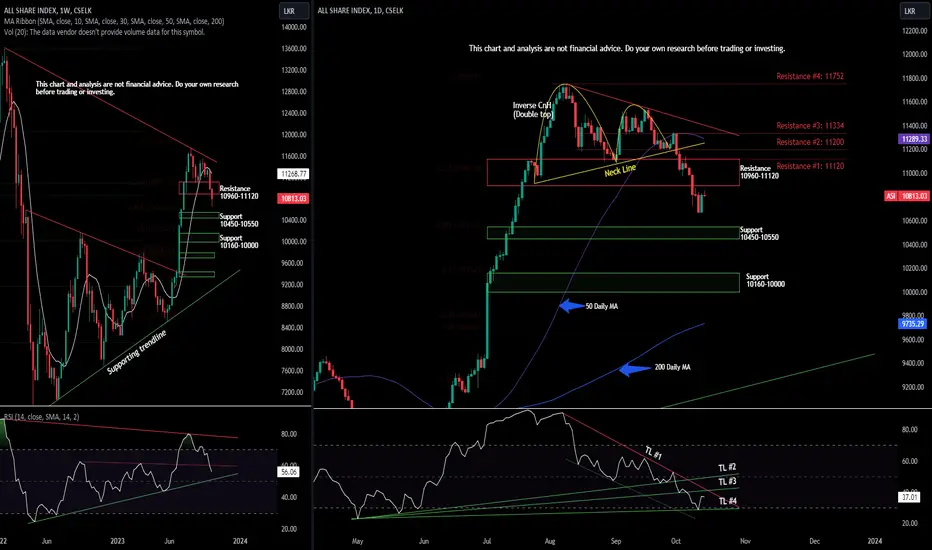
ASIThis chart and analysis are not financial advice. Do your own research before trading or investing.
01. ASI reaching two trend line resistance associated with a bearish divergence.
02. There is immediate support with 10, 50 DMAs.
03. On the RSI indicator it seems the TL #2 is giving the momentary support.

ASI Update on 26022024Support Zone - 10150 to 10350
Resistance Zone - 10800 to 11000
Disclaimer: The information and analysis provided in this publication are for educational purposes only and should not be construed as financial advice or recommendations to buy, sell, or hold any securities. The author and TradingView are not responsible for any investment decisions made based on the content presented herein. Always consult a financial professional before making any investment decisions.

ASI - Strong support levelASI need to stay above purple line in monthly chart.
Disclaimer: The information and analysis provided in this publication are for educational purposes only and should not be construed as financial advice or recommendations to buy, sell, or hold any securities. The author and TradingView are not responsible for any investment decisions made based on the content presented herein. Always consult a financial professional before making any investment decisions.

NSE All-Share Index Continues Its Impressive Bullish Movement!The Nigerian Stock Exchange All-Share Index (NSE ASI) continued its impressive performance in the last trading week ended January 12, 2024, registering a significant index gain of 4.24%. The market opened at 79,664.7 and closed the week at a robust 83,043.0. This marks another week of strong bullish momentum.
Leading the pack was the Consumer Goods sector, which saw a remarkable 9.6% increase in its index, closely followed by the Insurance sector with a 7.63% rise. The only sector to record a decline was Oil & Gas, which experienced a marginal loss of 1.61%.
Given the sustained upward trend with no signs of slowing down, the NSE ASI demonstrates strong potential for continued bullish growth in the coming weeks.
N.B!
- ASI price might not follow drawn lines . Actual price movement may likely differ from the forecast.
- Let emotions and sentiments work for you
- ALWAYS Use Proper Risk Management In Your Trades
#ASI
#NSEASI
#NGX
#ngxgroup
#ubagroup
#THISDAYLIVE
#FirstBankngr
#JaizBankNG
#fidelitybankplc
#wemabank
#UnityBankPlc
#UNIONBANK_NG
#MyFCMB
#StanbicIBTC
#ZenithBank
#gtbank
#myaccessbank
#SECNigeria

ASI/CSEALL - SLAnticipating a potential decline in price, the price is poised to reach a robust support zone between 10550 - 10460.
This level aligns with both a trendline support and the 150 EMA, strengthening its significance.
Notably, the MACD signals a bullish divergence. Expecting a descent to the support area followed by a rebound

🇱🇰 ASI NEXT PROJECTION WITH MARKET REACTIONASI has indeed shown a breakout and subsequent pullback within the bullish structure identified on the hourly timeframe. We are currently in a phase of anticipation, expecting the price to acknowledge the breached trend line as a support given the recent pullback formation. However, if the price fails to respond positively to the trend line as a support, we could witness a further decline. This decline has the potential to push the price of ASI back inside the established structure and even prompt a revisit towards the support level.

🇱🇰 ASI LONG PROJECTIONOn the hourly timeframe, ASI is currently moving within a bearish channel. A false breakout occurred at the hourly support level, leading to a reversal back towards the upper boundary of the channel. The lower highs formed by ASI within the bearish channel indicate a short-term bearish momentum. The recent price reversal respected the upper boundary of the channel, reinforcing the bearish trend.
To anticipate a potential upward rally, it is essential to await confirmation of a bullish breakout. Until such confirmation occurs, the prevailing expectation is for the bearish momentum to persist within the established channel.

ASPI UpdateThe ASPI in the uptrend in the weekly chart. meanwhile in the correction. based on past behavior, the potential support levels are at previous resistance levels as marked up.
this match with following.
MA50 and FB levels of 50% and 61.8%.
I am expecting the support for this correction to be between 9,800 and 10,000 levels.

ASICSELK:ASI
This chart and analysis are not financial advice. Do your own research before trading or investing.
The ASI continues to hold above the 10-day moving average (DMA) and the support zone ranging from 10800 to 10875.
The upcoming challenge lies at the resistance level of 10960-11120, where the index is expected to encounter the DMA 50. This zone presents a formidable barrier and should be regarded as a robust resistance level.
However, buoyed by positive Q results and the 2024 budget proposal, there is a potential for the index to breach this resistance zone effortlessly. Caution is advised, and close monitoring of the situation is crucial.
Analyzing the Relative Strength Index (RSI) indicator reveals a recent break below Trendline #3, followed by a descent. The RSI is now poised for an upward breakthrough, and if successful, it could signal a strong upward movement toward Trendline #4. Vigilance in observing these technical indicators is paramount.

ASICSELK:ASI
This chart and analysis are not financial advice. Do your own research before trading or investing.
The market index concluded the session within the support range of 10800-10875, with the 10-day moving average (DMA) situated in this zone as well. Sustaining this level is crucial, as a failure to do so may lead the index to descend towards the 10450-10550 range. However, before reaching this lower range, the index is anticipated to find support from the trend line.
Regarding the Relative Strength Index (RSI) indicator, the second trend line (TL #2) was breached to the upside during the session, but by the end of the day, the index failed to maintain this level.

ASICSELK:ASI
This chart and analysis are not financial advice. Do your own research before trading or investing.
At the close of the day, the 'ASI' index displayed strength as it closed within a robust support range of 10800-10875. If this momentum continues, we anticipate encountering the next significant resistance zone between 10960 and 11120, coinciding with the DMA 50.
Maintaining a position above the 10 DMA (Daily Moving Average) and RL #1 is vital at this moment.
Examining the RSI indicator, immediate support can be found around TL #3. Closing above TL #5 after surpassing TL #2 will indicate a clean and decisive upward movement.

ASI - All Share IndexThis chart and analysis are not financial advice. Do your own research before trading or investing.
CSELK:ASI
Despite the bearish tone on the weekly chart with a red candle, the daily chart paints a more optimistic picture as it closed with an engulfing bullish candle. Notably, the daily candle successfully closed above the 10-day moving average (DMA), indicating short-term strength.
However, challenges remain as the immediate resistance level stands firm at 10,874.27, and it's noteworthy that a short-term (ST) resistance trend line converges with this point. Beyond this immediate hurdle, attention shifts to the next resistance zone within the range of 10,960 to 11,120.
Turning our focus to the daily chart, it's worth mentioning that Trendline #1 (TL #1) offers crucial support to the Relative Strength Index (RSI). Although Trendline #3 (TL #3) was tested, it wasn't breached by the price, suggesting it might serve as a notable resistance level.

ASI - Possible pullbackMACD crossed (Blue and orange lines) in to downtrend. We can compare same pattern in last two peak times.

ASI - All Share IndexThis chart and analysis are not financial advice. Do your own research before trading or investing.
CSELK:ASI
After a "Gravestone Doji Candle" closed the previous day, the index saw a red candle, finding support at the 10-day moving average. The next immediate support is at 10662.30, with a broader support zone between 10450-10550.
This could be viewed as a retest of a Fibonacci level, indicating a potential trend reversal.
The Relative Strength Index (RSI) broke through TL#3 and is now looking for support from TL#1. It's crucial to closely monitor these developments for insights into market trends.

ASI - All Share IndexThis chart and analysis are not financial advice. Do your own research before trading or investing.
CSELK:ASI
Following a "Gravestone Doji Candle" closure the previous day, the index ended with a red candle. The immediate support stands at 10662.30, with the next support zone likely at 10450-10550.
The RSI broke TL#3 and is now seeking support from TL #1. Monitoring these developments is key.

ASI - All Share IndexCSELK:ASI
This chart and analysis are not financial advice. Do your own research before trading or investing.
In the weekly chart, the index closed with a bullish green candle, finding strong support within the 10450-10550 range. Additionally, the RSI indicator respected its supporting trend line.
Shifting to the daily chart, a robust green candle formed, breaking through the immediate resistance at 10847.27. The next key resistance zone for the index lies between 10960 and 11120, coinciding with the expected meeting point of the 10-day moving average (DMA).
Intriguingly, the RSI indicator on the daily chart exhibited promise as the index found support at Trend Line #4 and managed to break and close above both Trend Lines #1 and #3. The ultimate signal for a confirmed upward trend will be when Trend Line #2 is successfully breached.

ASI - All Share IndexThis chart and analysis are not financial advice. Do your own research before trading or investing.
CSELK:ASI
The index showed a positive sign as it concluded the day with a green candle, following four consecutive days of red candles. Notably, it displayed resilience around the support zone of 10,450-10,550, where the crucial Fibonacci 0.382 level is situated. The immediate challenge for the index is breaching the resistance level at 10,662.30.
Examining the daily RSI indicator, it found support from Trend Line #4, and the next hurdle is breaking through the immediate resistance represented by Trend Line #1.
On a weekly scale, the RSI index is currently seeking support from a key supporting trend line, underscoring the significance of this juncture in the market's behavior.

ASI - Down to 9400 9800 RangeASI is currently within an upward-trending channel and is expected to undergo a retracement, targeting levels around 9800 (50% Fibonacci retracement) or 9400 (68% retracement) before resuming its bullish momentum.

ASI - All Share IndexCSELK:ASI
This chart and analysis are not financial advice. Do your own research before trading or investing.

ASI - All Share IndexCSELK:ASI
This chart and analysis are not financial advice. Do your own research before trading or investing.