ASI - All Share Index"The left side is the weekly chart of a stock. In that, the RSI (Relative Strength Index) is showing a strong trend. It seems to be reaching around 10,500. On the other hand, the right side is the daily chart. In that, the RSI is indicating an oversold condition. It may need to come down a bit before reaching 10,500 on the daily chart."
ASI trade ideas

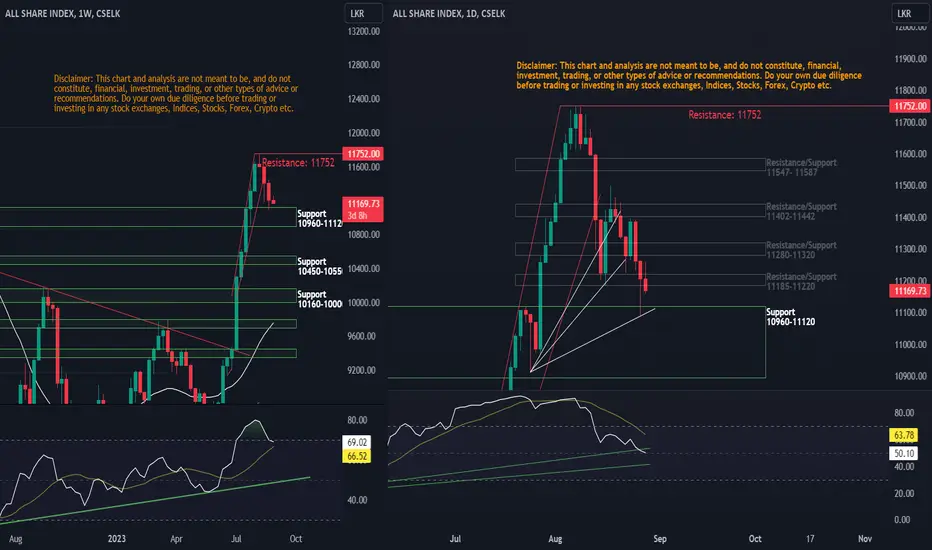
ASI - All Share IndexThis chart and analysis are not financial advice. Do your own research before trading or investing.
01. ASI has recently closed with a red candlestick pattern, indicating a potential bearish move. A crucial milestone for the next upward trend is breaking through resistance level #1.
02. The region between resistance levels #2 and #3 holds significant importance due to the convergence of technical factors. This area includes the neckline of a Cup and Handle (CnH) pattern and the 50-day moving average on the daily chart, making it a notable confluence zone.
03. To sustain its momentum, the RSI (Relative Strength Index) indicator should find support at trendline (TL) #3. Early indications of a breakout could emerge if the RSI successfully breaches trendlines #2 and #1.

ASI - All Share IndexThis chart and analysis are not financial advice. Do your own research before trading or investing.

ASPI LOOKING FOR BEARISH IMPULSE INSIDE THE CHANNELASPI is moving perfectly inside the channel formed where we see the recent price is being respected on the upper boundary formed. The reversal signals for a retracement back towards the lower boundary formed which is holding close to 50%-61% on the fibonacci retracements.

ASI - All Share IndexDisclaimer: This chart and analysis are not meant to be, and do not constitute, financial, investment, trading, or other types of advice or recommendations. Do your own due diligence before trading or investing in any stock exchanges, Indices, Stocks, Forex, Crypto etc.
CSELK:ASI
01. Holding the Support 11320-11520!
02. Distribution or Accumulation?
03. Inverted HnS pattern!

ASI - All Share IndexDisclaimer: This chart and analysis are not meant to be, and do not constitute, financial, investment, trading, or other types of advice or recommendations. Do your own due diligence before trading or investing in any stock exchanges, Indices, Stocks, Forex, Crypto etc.
CSELK:ASI

ASPI PERSPECTIVEVery clearly price of ASI respects the resistance formed and also the upper boundary created. Here we are expecting to see a correction leg to the downside inorder to accumulate more buying pressure in the market. This correction may retrace back close or below 50% (FIB) on the recent bullish trend formed.
We are looking over into a possible market correction towards the highlighted key support on the bottom. The following idea may be invalidated after a break above the resistance formed.

ASI - All Share IndexDisclaimer: This chart and analysis are not meant to be, and do not constitute, financial, investment, trading, or other types of advice or recommendations. Do your own due diligence before trading or investing in any stock exchanges, Indices, Stocks, Forex, Crypto etc.
CSELK:ASI
ASI OF THE NGX TRAPPED ON AN ASCENDING CHANNELASI of the NGX trapped on an ascending channel. best to wait for a clear break of the current zone to know if the will be a bounce or a break of current resistance

ASI - All Share IndexDisclaimer: This chart and analysis are not meant to be, and do not constitute, financial, investment, trading, or other types of advice or recommendations. Do your own due diligence before trading or investing in any stock exchanges, Indices, Stocks, Forex, Crypto etc.
CSELK:ASI

ASI (All share Index) on My ViewClear big bull market, Now at minor resistance level , if it break with some retests clearly can see new ATH .

ASI - All Share IndexDisclaimer: This chart and analysis are not meant to be, and do not constitute, financial, investment, trading, or other types of advice or recommendations. Do your own due diligence before trading or investing in any stock exchanges, Indices, Stocks, Forex, Crypto etc.
CSELK:ASI

Bullish Breakout in ASPI: Strong Trend Continuation ExpectedASPI is currently experiencing a bullish breakout from a triangle pattern, indicating a strong upward trend. A daily resistance level near 11500 has been identified, suggesting a possibility of a return to the highlighted zone. The prevailing market sentiment supports the continuation of the bullish trend, making it likely to reach the anticipated target effortlessly.

CSE-ASI 6/12As expected Market took a bullish turn with a 1.161B, turnover after making a HH & HL formation.. this official makes the bourse structure in to bullish one. Do note that daily Bullish divergence has already activated. Next immediate resistance will be at 9155-9200 range.

Critical Levels to Watch in ASILook at Blue areas and Fib Levels.
Strong Support Level - 7700 ( ASI should protect this level )

ASI - Falling Wedge Pattern in CSEASI might bounce from 8500 level. Closely monitor this falling wedge pattern and fib levels in the chart.
Disclaimer : The information and analysis provided in this publication are for educational purposes only and should not be construed as financial advice or recommendations to buy, sell, or hold any securities. The author and TradingView are not responsible for any investment decisions made based on the content presented herein. Always consult a financial professional before making any investment decisions.

ASI - All Share IndexDisclaimer: This chart and analysis are not meant to be, and do not constitute, financial, investment, trading, or other types of advice or recommendations. Do your own due diligence before trading or investing in any stock exchanges, Indices, Stocks, Forex, Crypto etc.
CSELK:ASI
ASI
The index didn't manage to break through the resistance of 9300 - 9350 . This is a GP rejection on FIB.
The day closed with a shooting star candle pattern.
There is a bearish divergence created.
A DEATH CROSS scenario is there where the MA 50 has crossed the MA 200 in a declining phase. But at the moment the both MAs are flattened out.
There will be an immediate support from the rend line created by the most recent HH points.

ASI - All Share IndexDisclaimer: This chart and analysis are not meant to be, and do not constitute, financial, investment, trading, or other types of advice or recommendations. Do your own due diligence before trading or investing in any stock exchanges, Indices, Stocks, Forex, Crypto etc.
CSELK:ASI
ASI
The index came down for the third day and closed above the support zone 9150-9100.
This area might be the potential area where a HL point can be created.
The trend line from current and last HH points now can act as a resistance which is near to the next resistance zone.

CSE - ASI 6/19After recent breakout bourse took a breather after getting rejected at golden pocket fib level.
currently its nearing the support zone roughly at 9150 range.. expecting a bounce here while forming another HH and HL formation. Failure to that pullback could extend to 9030 levels.
lets watch!
