The opportunity in NULSUSDTThe opportunity in NULSUSDT
The entry point is 0.62–0.53$
First target 0.85$
second target 1$
NULSUSDT trade ideas

NULS/USDT (Nuls) The fifth and final wave +400%be cerfull
This is the fifth and final wave Before the bear market.
Nuls Target At Least 400% - 450% . = 1.61 Fib
Best price to buy
0.45$ - 0.55$
Sell
2.5$ - 3$

Nulsusdt135% resumed and we can see 1.10$ in short term and after a weekly close above it another rally may begin And price go till 3$
Macd and rsi is show good
Set stop too

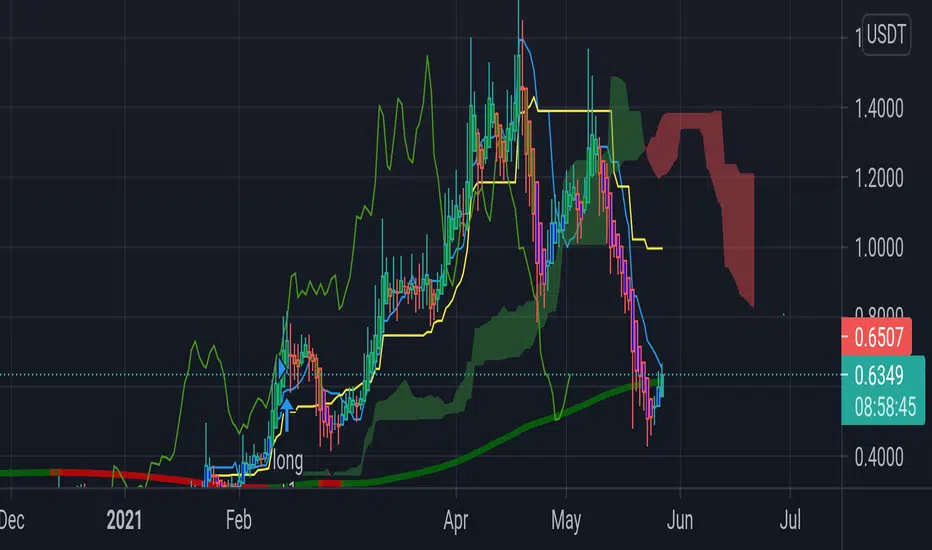
Long 🟢 Bullish Wedge, BullflagAI thinks a wedge pattern broke out (green) on the chart.
The upside movement means a bullish setup.
Retracement in this setup prints a bullish flag (blue).
The price will emerge from the flag and reach the target box (orange).
A retest of the wedge support lines is possible.
Don't liquidate yourself!

NULS / TETHERUSNULS
She has a strong project
The numbers are good and they are about to pump. We see the formation of the head and shoulders technical pattern
go to market
Target 1.2 (70%)

NULS USD Bullish Continuation Soon --14 X + PossibleNULS has finished it's long retrace after its initial 24x from the bottom back in March 2020, and it looking to rise upwards once again.
Measuring with the Fibonacci tool after it's long retrace I am finding a possible mid term target of $7.20 per NULS, from it's current price of $.50 that is greater than 14x Gains.
The RSI has a long bullish trend and is at the buy zone again currently.
The Stoch RSI is oversold and indicating a good entry.
NULS has found support on the Moving Averages as well as Historic support from previous Tops.
Nuls is a buy currently, as it should soon go bullish.
Targets
$2.43
$7.20
Higher targets should follow $15 is likely over the longer term, and possibly higher.


NULS ATH REVERSE W usually brings rapid rise. Nuls needs to make support 0.80, after 3 targets we can see ATH. ATH TARGET $ 8.57

Wait Self-learning purposes
Nuls is a good project to hold for a long term but for 4HR chart, is it a bear flag formation? Please comment.
Uptrend confirmation : 0.74
Resistance: 0.72
Support: 0.5966
DYOR-


NULS buy signalNuls got rejected by resistance yesterday now today is pushing back up , and we have a buy signal

🆓Nuls (NULS) May-8 #NULS $NULSNULS has conquered the 1.2$ zone and it has high possibility to keep moving up to 1.5$ or even make a new rally up to 2$ and 3$ in this May and next June.
📈BUY
-Buy: 1.17-1.23$. SL if B
-Buy: 1.46-1.54$ if A. SL if B
📉SELL
-Sell: 1.46-1.54$. SL if A
-Sell: 1.95-2.05$. SL if A
-Sell: 2.95-3.05$. SL if A
♻️BACK-UP
-Sell: 1.17-1.23$ if B. SL if A
-Buy: 0.97-1.03$ if A. SL if B
-Buy: 0.88-0.92$. SL if B
❓Details
🕯Timeframe : 1 Day
📈Red Arrow : Main Direction as BUY & SELL section
📉Blue Arrow : Back-Up Direction as BACK-UP section
🟩Green zone : Support zone as BUY section
🟥Red zone : Resistance zone as SELL section
🅰️A : The Close price of candlestick is Above the zone
🅱️B : The Close price of candlestick is Below the zone


My ideaIf BTC doesn't drop
Don't judge my analysis by my victories, but by my defeats.
See results.
Thanks.
