Crude oil---sell near 67.50, target 65.00-60.00Crude oil market analysis:
Crude oil has also started to fluctuate recently. Pay attention to the impact of contract delivery on the trend of crude oil. The daily line of crude oil does not show the strength of its rebound. In terms of operation, it is still a rebound sell. Crude oil continues to be bearish. The situation in the Middle East has not made any major moves temporarily, and the support for crude oil is limited. Pay attention to the selling opportunities near 67.30 today.
Operational suggestions:
Crude oil---sell near 67.50, target 65.00-60.00
CL1! trade ideas

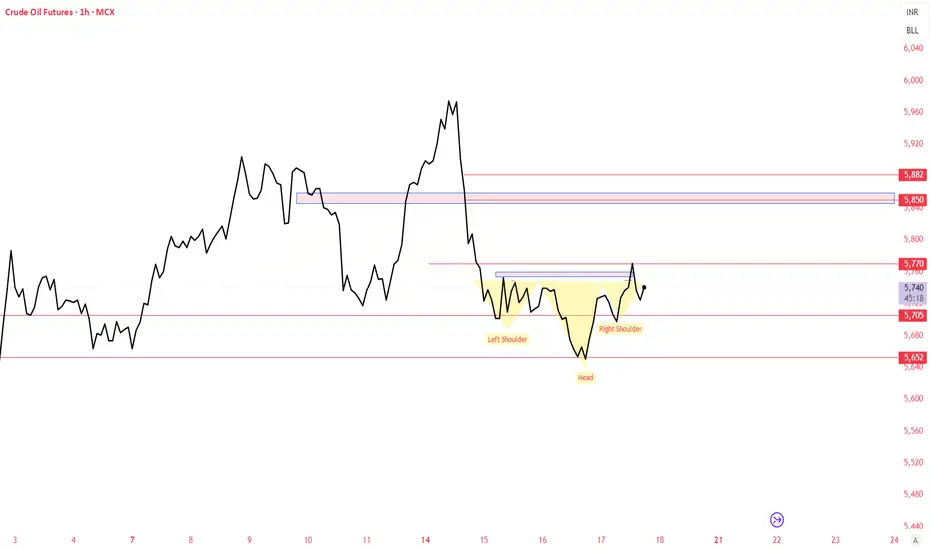
CRUDEOIL - MCX INVERTED HEAD AND SHOULDERCrudeoil on 1 hour time frame forming Inverted head shoulder which is consider as bullish Pattern. Strong Support of 5680 , crudeoil may do 5826-5820-5850
Please do your own research before taking any trading decisions
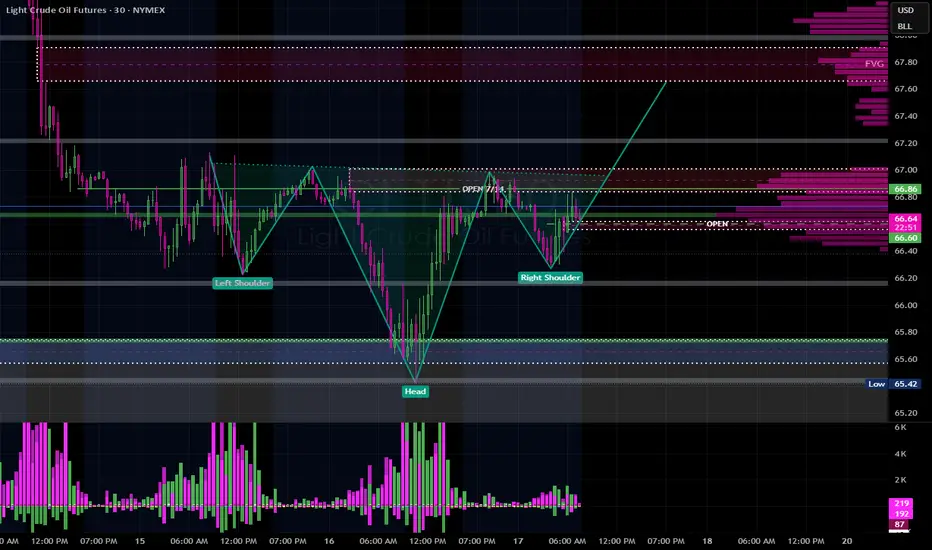
HEAD & SHOULDERSLooks like a nice H&S pattern forming, looking to get in around open price to the upside, for it to break past 67.00 to reach 67.66-67.90.
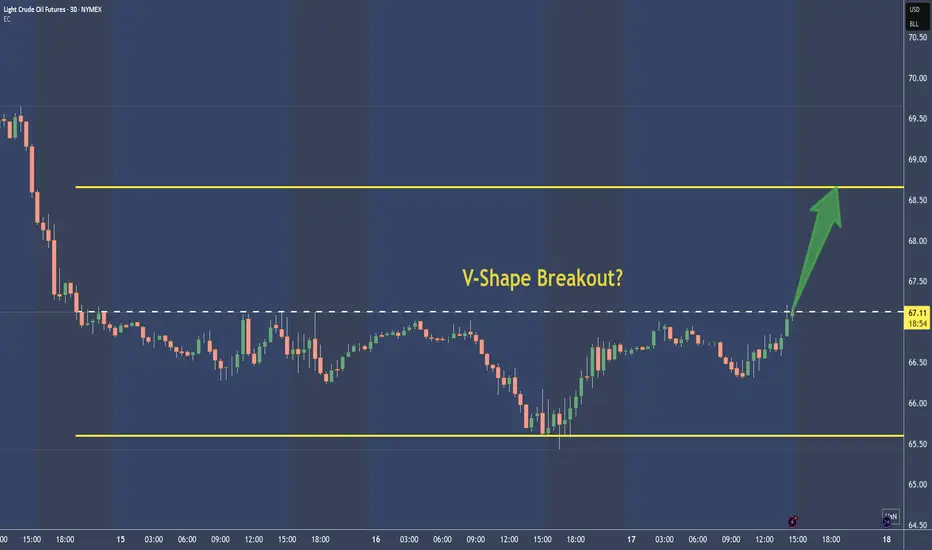
Crude Oil - CL shows a superb V-Shape Long-TradeNot much to say here.
To me it's just a BUY, with the target around the upper yellow line. Stop depends on movement. I add and remove Contracts, until there is a nice ternd or momentum established.
Trade is toast below the V.
Crude oil-----Sell near 66.80, target 65.00-62.00Crude oil market analysis:
The recent crude oil daily line began to decline, but a small V appeared last night, which was also caused by the situation in the Middle East. Israel bombed Syria and crude oil began to rebound. Overall, crude oil is still bearish. We consider continuing to sell it when it rebounds. It has not broken near 64.00, and it is difficult to form a large unilateral. The suppression position is near 66.80. Consider selling it near it.
Fundamental analysis:
Trump’s dissatisfaction with Powell has not been a day or two. Conflict is inevitable, and the impact on gold is also short-term. Yesterday’s pull-up and dive is a case in point.
Operational suggestions
Crude oil-----Sell near 66.80, target 65.00-62.00

MCL Just RAN the Highs and Died. Beautiful. You ever watch price grind into a supply zone like it’s got no clue what's coming, then slap the trend line like it owes it money? That’s what MCL did this morning. It ran the previous day high, tapped into a juicy supply zone, gave us a textbook order block rejection and I said, “bet.”
I’m not here for 300 IQ Fibonacci spirals or Jupiter retrograde entries I just want clean structure, manipulated highs, and a breakdown that pays the bills. Let’s dig in.
Setup Overview (15-Min Chart)
Bias: Bearish
Setup Type: Liquidity Run ➝ OB Retest ➝ Trend Continuation
Context & Narrative:
PDH (67.01) was swept early. Liquidity grab? Price got yeeted from supply after faking momentum. We got a clean Order Block Retest at 66.59, respecting the descending EMA and HTF structure.
Entry Structure:
- Entry - 66.39 Retest rejection + momentum shift
- TP1 - 66.10 Intra-day structure low
- TP2 - 65.80 Demand zone front-run
- PDL - 65.40 Potential deeper fade if momentum holds
Confluence Checklist:
- Sweep of prior highs (PDH liquidity grab)
- Strong supply reaction + OB retest
- Bearish EMA slope holding price down
- Momentum shift + clean intraday structure
- Entry gives >2R to TP1, >4R to TP2
Risk Notes:
If price reclaims 66.70+ and closes above OB → bias invalidated. Don’t marry the trade this is oil, not Tinder.

WTI(20250717)Today's AnalysisMarket news:
The annual rate of PPI in the United States in June was 2.3%, lower than the expected 2.5%, the lowest since September 2024, and the previous value was revised up from 2.6% to 2.7%. Federal Reserve Beige Book: The economic outlook is neutral to slightly pessimistic. Manufacturing activity declined slightly, and corporate recruitment remained cautious.
Technical analysis:
Today's buying and selling boundaries:
65.20
Support and resistance levels:
66.59
66.07
65.74
64.67
64.33
63.83
Trading strategy:
If it breaks through 65.74, consider buying in, and the first target price is 66.07
If it breaks through 65.20, consider selling in, and the first target price is 64.67
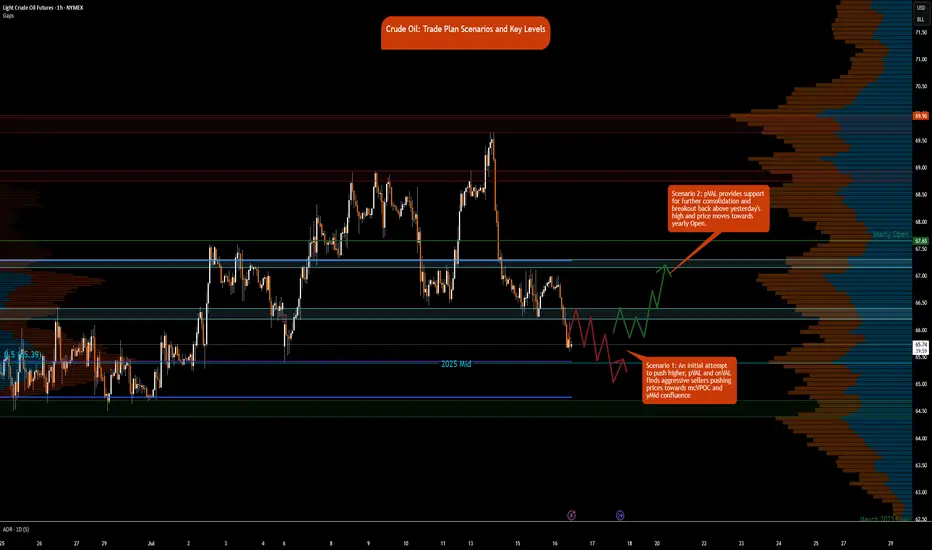
Crude Oil Trade Plan Scenarios and Key Levels
NYMEX:CL1!
It’s Wednesday today, and the DOE release is scheduled for 9:30 a.m. CT. This may provide fuel—pun intended—to push prices out of the two-day consolidation. Also, note that the August contract expires on July 22, 2025. Rollover to the September contract is expected on Thursday/Friday. You can see the pace of the roll here at CME’s pace of roll tool . The chart shows that rollover is about 70% complete, and CLU25 has higher open interest. Note, the front-month August contract is still trading at higher volume.
What has the market done?
Crude oil is in a multi-distribution profile since the peak witnessed during the Iran-Israel conflict. Crude oil formed a strong base above the 64s and traversed towards the 69s. Prices were rejected at these highs and have since reverted back towards the monthly Volume Point of Control, monthlyVPOC.
What is it trying to do?
The market is in active price discovery mode and has formed multi-distributions since June 23. The market has been consolidating after prices at highs were rejected.
How good of a job is it doing?
The market is active and is also providing setups against key levels. Patience to take trades from these higher time frame levels is what is required to trade crude oil currently. Otherwise, there is a lot of volatility and chop that can throw traders off their plan.
Key Levels:
• Yearly Open: 67.65
• Neutral zone: 67.15–67.30
• 2-Day VAL (Value Area Low): 66.40
• Neutral zone: 66.40–66.20
• 2025 Mid-Range: 65.39
• Key Support: 64.40–64.70
What is more likely to happen from here?
Scenario 1: An initial attempt to push higher, pVAL and onVAL finds aggressive sellers pushing prices towards mcVPOC and yMid confluence
Scenario 2: pVAL provides support for further consolidation and break back above yesterday's high and price moves towards yearly Open.
Glossary:
pVAL: Prior Value Area Low
onVAL: Overnight Value Area Low
yMid: 2025 Mid-Range
mcVPOC: Micro Composite Volume Point of Control
CL BULLISHHello,
I just noticed that oil has a good chance of rising, with a slight short-term uptrend, and I hope this helps you with your trading.
See you soon.

WTI(20250716)Today's AnalysisMarket news:
① The annual rate of the overall CPI in the United States in June rose to 2.7%, the highest since February, in line with market expectations, and the monthly rate was 0.3%, the highest since January, in line with market expectations; the annual rate of the core CPI rose to 2.9%, the highest since February, lower than the expected 3%, but slightly higher than 2.8% last month, and the monthly rate was 0.2%, lower than the market expectation of 0.3%.
② Interest rate futures still show that the Fed is unlikely to cut interest rates this month, but there is a high possibility of a 25 basis point cut in September.
③ Fed mouthpiece: The CPI report will not change the Fed's policy direction.
④ Trump: Consumer prices are low and the federal funds rate should be lowered immediately. The Fed should cut interest rates by 3 percentage points.
⑤ Fed Collins: The core inflation rate is expected to remain at about 3% by the end of the year, and the Fed should maintain active patience.
Technical analysis:
Today's buying and selling boundaries:
65.66
Support and resistance levels:
66.49
66.18
65.98
65.34
65.14
64.83
Trading strategy:
If the price breaks through 65.66, consider buying, the first target price is 65.98
If the price breaks through 65.34, consider selling, the first target price is 65.14
CRUDEOIL FUTURE - BULLISH VIEWCrudeoil just showed a reversal from 0.618 golden fibonnaci zone. It may go till 6000-6100 levels in coming weeks with 5700 as strong support.
please do your own research before taking any trades. This chart is only for educational purpose

Oil Futures Approaching Key Reversal Zone – Bullish HarmonicOil futures may be forming a bullish Shark harmonic pattern, with price approaching the potential reversal zone at point D. This pattern suggests a possible bounce if buyers step in around this area. If price action shows signs of support or a shift in momentum, it could offer a solid long opportunity. Look for confirmation like bullish candles or indicators turning up before entering. If the pattern plays out, it could provide a strong risk-to-reward setup.

WTI(20250715)Today's AnalysisMarket news:
Sources said that after Trump's latest trade tax threat, the European Central Bank will discuss a more negative scenario next week than expected in June. The ECB is still expected to keep interest rates unchanged at its meeting on July 24. Discussions on rate cuts are still postponed to September.
Technical analysis:
Today's buying and selling boundaries:
66.63
Support and resistance levels:
69.20
68.24
67.62
65.65
65.02
64.06
Trading strategy:
If it breaks through 66.63, consider buying in, the first target price is 67.62
If it breaks through 65.65, consider selling in, the first target price is 65.02

WTI Crude Oil Reverses Lower Near $70 ResistanceA bearish engulfing candle has formed on the daily WTI crude oil chart, with its high perfectly respecting the 38.2% Fibonacci retracement just beneath the $70 handle. Given that the bounce from the June low has been relatively weak compared to the sharp decline from $78, I’m now on alert for a potential break beneath the $64 support level.
That said, the 200-day SMA and EMA currently sit between $65.21 and $65.31, which could offer near-term support. Should oil prices attempt to grind higher within the 1-hour bullish channel, bears may look to fade rallies into the weekly pivot (67.59) or the $68.00 handle, positioning for a potential rollover. A clean break below the 200-day averages would shift focus firmly back to $64, near the June low.
Matt Simpson, Market Analyst at City Index and Forex.com

CL down sub $60 before moving up above $73Expected support or reversal zone based on last swing high for CL is at $60. This matches with 0.786 fib level of last move up, suggesting a standard SBS structure forming. Expecting a move up to at least $73 (fib 0.236), possibly also well beyond this.
Based on time fib of last swing high I expect the bottom to occur before July 20th.

Crude oil------sell near 70.00, target 66.70-63.00Crude oil market analysis:
Recently, crude oil has been rising, and buying is slowly climbing, but the amplitude is not particularly large. The daily line has not formed a large buying pattern. It is currently a technical repair market after falling too much. Today's idea is to sell on the rebound. Pay attention to the suppression near 70.00. If this position is broken, it may change the short-term trend and buying may rise.
Fundamental analysis:
Last week, Trump increased tariffs on Canada and is about to increase tariffs on Brazil. There is no sign of stopping the tariff war. It is long-term bullish for gold. The situation in the Middle East has not completely stopped, and it is also long-term suppression of the US dollar to support gold.
Operation suggestions:
Crude oil------sell near 70.00, target 66.70-63.00

US OILUS OIL is reaching towards important zone which can give us a good move to the upside after it sweeps OLD LOW

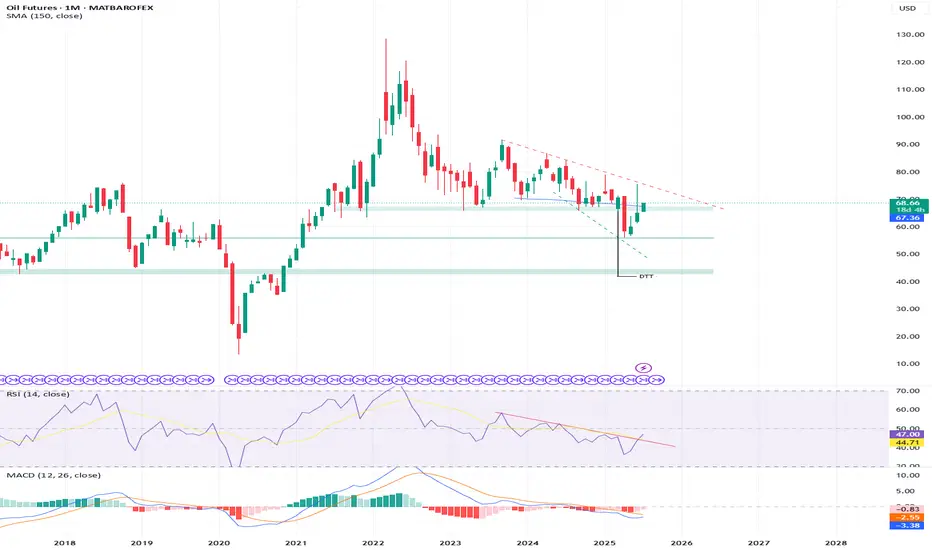
WTI Crude - Turning Bullish? Published as a supplementary analysis for BRENT CRUDE and LIOC, with further coverage to follow.
* WTI has successfully reclaimed its 4-year support line, which was breached in April 2025.
* The Monthly Momentum Indicator reveals a robust bullish breakout, signaling renewed strength.
* As long as WTI maintains its 4-year support line, caution is warranted when considering bearish positions.
Crude Compression, Flagging Into Fire or FailureCrude Oil has been grinding higher within a clean rising wedge (bearish flag), forming within the aftermath of a strong sell-off. Price is now testing a key Intraday Fair Value Gap (1H FVG) inside a broader HTF Macro Supply Zone, while respecting a steep trend line of support.
This structure sets up a textbook decision point. Continuation toward macro liquidity or reversal and breakdown.
Bearish Setup (Primary Thesis)
Rejection off the Intraday FVG (1H) or Macro Supply Zone. Close below green trend line with momentum/volume
Bearish Entries:
Entry #1 (Aggressive): $69.90–$70.10 → wick rejection inside FVG
Entry #2 (Conservative): $68.20 → trendline break + close below
Stop Loss Options:
Tight SL: $70.80 (above intraday FVG)
Wide SL: $72.50 (above macro supply zone)
Bearish TPs:
TP1: $67.00 → channel low
TP2: $65.00 → mitigation zone
TP3: $64.00 → FVG fill + prior swing low (final target)
The Ideal setup: FVG rejection + trend line break + aggressive follow-through = hold for full breakdown.
Bullish Setup (Alternate Scenario)
Clean breakout + 1H/4H candle close above Intraday FVG. Break and retest of channel top as new support. Price holds above $70.50 with strength
Bullish Entry:
Breakout & retest at $70.10–$70.30
Stop Loss:
Below FVG/demand pocket: $68.30
Bullish TPs:
TP1: $72.50 → prior swing high
TP2: $74.00 → macro trendline test
TP3: $77.00 → macro liquidity sweep
Best setup: breakout + retest with increasing volume and no rejection at macro supply.
My Summary:
Bias. - Bearish (Primary)
Structure - Bearish flag within HTF downtrend
Price Action - Testing overhead supply + intraday FVG
Volatility - Constricted, ripe for breakout
Risk Level - Low-risk entries near supply or trend line
Model Tag - Mean Reversion Rejection / Momentum Breakdown
This is a high-probability setup with clear invalidation on both sides. Use a confirmation based approach to reduce drawdown and avoid fake outs. Plan your entries based on how price reacts at this decision zone. Be patient the cleanest trade may be on the second move, not the first. Happy Trading everyone.

CL1! Short Setup – Fading Into Volume Shelf📉 CL1! Short Setup – Fading Into Volume Shelf
🔹 Context:
Price just tapped into a heavy upper volume shelf (68.35–68.50) — the exact area where the prior breakdown started. This zone aligns with rejection highs and the upper edge of the VRVP profile.
📌 Setup Logic:
🔺 Entry: 68.36–68.50 (into supply zone)
⛔ Stop: 68.75 (above liquidity peak)
🎯 Target: 66.78 (prior demand + volume node)
📐 RRR: ~4.0:1
⚠️ Trigger: Do not enter early — wait for rollover of price which it looks like we are getting now.
📊 Why It Matters:
📈 VRVP shows clear upper and lower volume shelves
📛 Price has overextended into a prior rejection zone
🔁 Potential for a mean-reversion leg once we confirm momentum breakdown
📷 See attached chart for full zone layout
🧠 Let me know if you’re entering or watching this one 👇
#CrudeOil #CL1 #FuturesTrading #VolumeProfile #SciQua #OrderFlow

Crude Oil Trade Idea: Intraday mechanicsNYMEX:CL1! NYMEX:MCL1!
Bigger Picture:
Traders should note that news headlines do not always drive the price action. More often, news outlets look for narrative to align with the price action.
Previously, it was about the supply glut and worsening demand due to an uncertain outlook. Now the latest news flow is about Aramco OSP rising, OPEC+ adding another 548K bpd in August — higher than anticipated 411K — of the wounding of involuntary cuts. News outlets now view this as signs of demand growth and low inventories.
What has the market done?
Market has consolidated, building acceptance around microComposite Volume Point of Control at 65.50 (mcVPOC). Market then broke out of this balance.
What is it trying to do?
Market is building value higher; 2-day mcVPOC is at 68.29.
How good of a job is it doing?
Market is holding support and has tested resistance multiple times. It has also held support.
What is more likely to happen from here?
Further movement higher as long as it holds above support and yearly open confluence in the short term.
Key Levels:
• Resistance zone: 68.95 - 68.85
• pHi: 68.87
• 2-day VPOC: 68.29
• pSettlement: 68.38
• yOpen: 67.65
• Support zone: 67.70 - 67.50
• pLow: 67.89
Primary Scenario:
Crude oil pit session begins with open auction in yesterday’s range. Prices move lower to test prior day's low, 2-day balance support in confluence with yearly open. Prices push back higher towards yesterday's settlement and 2-day Volume Point of Control (VPOC) at 68.33.
Secondary Scenario:
Crude oil pit session begins with open auction in yesterday’s range. Market consolidates and chops around pSettlement and 2-day VPOC. Market takes out overnight high, fails to go further higher, and reverts lower. Settles below overnight low, however staying above prior low to continue one-time framing higher for the regular trading hours (RTH).

CRUDE OILPreferably suitable for scalping and accurate as long as you watch carefully the price action with the drawn areas.
With your likes and comments, you give me enough energy to provide the best analysis on an ongoing basis.
And if you needed any analysis that was not on the page, you can ask me with a comment or a personal message.
Enjoy Trading ;)

bearish on oilequal lows on crude oil, but with dxy looking bullish, i feel like it would be a little problamatic trying to find a smooth ride lower. The price action is thier tho, i would defietly not be trying to long when we have eqaul lows.
