Oil's (CL) Rally Likely to Stall, Signaling Deeper LossesThe current market cycle for Light Crude Oil (CL), starting from its high on January 15, 2025, is unfolding as a double three Elliott Wave pattern. This technical structure suggests a corrective phase with alternating declines and recoveries. From the peak, the price dropped to 55.12, completing wave (W), followed by a rally to 65.07, marking the end of wave (X). The decline has since resumed in wave (Y), which is breaking down into a WXY pattern, indicating further downside momentum.
Within wave (Y), the initial decline, wave W, is forming as a zigzag. From the wave (X) high, the price fell to 61.53 (wave (i)), then rallied to 63.92 (wave (ii)). The decline continued in wave (iii) to 56.39, followed by a bounce to 59.87 in wave (iv). The final drop in wave (v) reached 55.30, completing wave ((a)) in a higher degree. Currently, wave ((b)) is unfolding as a zigzag, with its first leg, wave (a), reaching 60.26. A pullback in wave (b) is expected soon, followed by a rise in wave (c) to complete wave ((b)).
Looking ahead, as long as the key resistance at 65.07 holds, any rally is likely to fail after 3, 7, or 11 swings, leading to further declines. Traders should watch these levels closely for potential selling opportunities.
CL1! trade ideas

[USOIL] Trade ideaEntered a new short position today with the oil news and want to see the $52.0 level reclaimed.
Great Trade !

Oil prices (WTI) remain bearish below $65Introduction: In a market analysis we brought you in mid-April, we explained that the price of US crude oil on the commodities market had broken a pivotal technical level, the price of $65 per barrel of Texas crude oil (WTI). As the benchmark for the price of black gold in the United States, this further fall in the price of oil is a very good thing for US disinflation, with the nominal PCE price index falling to 2.3% at the latest update.
Bear in mind the following two factors: oil remains bearish as long as it stays below the new technical resistance of $65. The bearish fundamentals are multiple and concern both supply and demand. Finally, this gives grounds for optimism that inflation will continue to fall, despite the trade war.
1) Oil supply & demand: the fundamentals are bearish
The two main factors driving down the price of oil in the energy segment of the commodities market are as follows, and concern oil supply.
- New historical records for US oil production, which could reach 28 million barrels per day by 2028 under the Trump Administration's drilling policy. By 2025, US oil production is expected to exceed 22 million barrels/day, or more than 20% of global production (see table below, taken from OPEC's latest monthly report). This massive US oil production is the primary explanation for the downward trend in the price of oil on the stock market.
- Added to this is the renewed rise in production by OPEC member countries, which between them account for 25% of world production, and even 33% if we include Russia as part of OPEC+. Indeed, strong opposition has erupted within the 12 member countries, and the leader among them (Saudi Arabia, with 9 million barrels a day on its own) has decided to increase its production once again in order to sell more, increase its market share but also drive prices down, and thus “punish” member countries that have not respected production quotas in recent months (notably Iraq and Kazakhstan). This combined increase in production from the USA, Saudi Arabia and Russia is putting downward pressure on prices.
2) Technical analysis of the oil price reveals a bearish message below resistance at $65
The break of support at $65 this spring therefore has strong fundamental justifications, and according to the chartist rule of polarity change, this price level now constitutes major technical resistance.
Only the reintegration of this level, i.e. a breakout of resistance on a daily closing basis, would signal a bullish reversal in the price of oil on the stock market.
Conclusion: Oil supply (i.e. production) will continue to have a bearish effect on prices this year. For the price of black gold to rebound in any significant way, trade agreements between the USA and China, and the USA and the EU, would be needed to revive the prospects of rising global oil demand. In the absence of this, the price is technically bearish below $65, with the next major support at $45/50.
DISCLAIMER:
This content is intended for individuals who are familiar with financial markets and instruments and is for information purposes only. The presented idea (including market commentary, market data and observations) is not a work product of any research department of Swissquote or its affiliates. This material is intended to highlight market action and does not constitute investment, legal or tax advice. If you are a retail investor or lack experience in trading complex financial products, it is advisable to seek professional advice from licensed advisor before making any financial decisions.
This content is not intended to manipulate the market or encourage any specific financial behavior.
Swissquote makes no representation or warranty as to the quality, completeness, accuracy, comprehensiveness or non-infringement of such content. The views expressed are those of the consultant and are provided for educational purposes only. Any information provided relating to a product or market should not be construed as recommending an investment strategy or transaction. Past performance is not a guarantee of future results.
Swissquote and its employees and representatives shall in no event be held liable for any damages or losses arising directly or indirectly from decisions made on the basis of this content.
The use of any third-party brands or trademarks is for information only and does not imply endorsement by Swissquote, or that the trademark owner has authorised Swissquote to promote its products or services.
Swissquote is the marketing brand for the activities of Swissquote Bank Ltd (Switzerland) regulated by FINMA, Swissquote Capital Markets Limited regulated by CySEC (Cyprus), Swissquote Bank Europe SA (Luxembourg) regulated by the CSSF, Swissquote Ltd (UK) regulated by the FCA, Swissquote Financial Services (Malta) Ltd regulated by the Malta Financial Services Authority, Swissquote MEA Ltd. (UAE) regulated by the Dubai Financial Services Authority, Swissquote Pte Ltd (Singapore) regulated by the Monetary Authority of Singapore, Swissquote Asia Limited (Hong Kong) licensed by the Hong Kong Securities and Futures Commission (SFC) and Swissquote South Africa (Pty) Ltd supervised by the FSCA.
Products and services of Swissquote are only intended for those permitted to receive them under local law.
All investments carry a degree of risk. The risk of loss in trading or holding financial instruments can be substantial. The value of financial instruments, including but not limited to stocks, bonds, cryptocurrencies, and other assets, can fluctuate both upwards and downwards. There is a significant risk of financial loss when buying, selling, holding, staking, or investing in these instruments. SQBE makes no recommendations regarding any specific investment, transaction, or the use of any particular investment strategy.
CFDs are complex instruments and come with a high risk of losing money rapidly due to leverage. The vast majority of retail client accounts suffer capital losses when trading in CFDs. You should consider whether you understand how CFDs work and whether you can afford to take the high risk of losing your money.
Digital Assets are unregulated in most countries and consumer protection rules may not apply. As highly volatile speculative investments, Digital Assets are not suitable for investors without a high-risk tolerance. Make sure you understand each Digital Asset before you trade.
Cryptocurrencies are not considered legal tender in some jurisdictions and are subject to regulatory uncertainties.
The use of Internet-based systems can involve high risks, including, but not limited to, fraud, cyber-attacks, network and communication failures, as well as identity theft and phishing attacks related to crypto-assets.

WTI Crude oil Holds Support Despite OPEC Production IncreaseWTI crude was on the ropes Monday morning following another surprise production increase from OPEC+. Yet despite the weak start to the week, oil prices held above the April low despite the bearish headlines.
Given we've already seen a -15% decline over the prior eight days and a bullish divergence has formed, I suspect some bullish mean reversion is due. Bulls could seek a move to the $60 area, near the April VPOC. Note that the December 2023 low might also provide some resistance along the way.
Matt Simpson, Market Analyst at City Index and Forex.com

Crude Oil 4h time frame , potential double bottom🛢️ WTI Crude Oil (WTI3!) 4H Chart Analysis – May 5, 2025
🧠 Technical Snapshot:
Market Structure:
Clear downtrend from late April into early May.
Price recently found support at $54.38, a level that previously held as demand in early April.
Current Price Action:
Strong bullish reaction from the $54.38–54.16 zone.
Breakout attempt forming a higher low after retesting the lows, suggesting a potential bullish reversal or range play.
Trade Setup Observed:
Entry: ~$56.08
Stop-Loss: ~$54.17
Take-Profit: ~$63.50
Risk-to-Reward: ≈ 1:3.5 — excellent setup from a reward perspective.
🔍 Bias: Bullish (Short-term to Mid-term Reversal)
Why?
Price bounced from key support zone where price also previously reversed in early April.
Bullish engulfing candle suggests buyer interest.
Entry aligned with a potential double-bottom formation.
📍 Key Technical Levels:
Support:
$54.38 (Major swing low support)
$54.16 (Stop zone)
Resistance:
$63.50 (Major horizontal resistance zone)
Above $63.50 = Potential trend reversal confirmation
🔔 Strategy Suggestion:
A pullback entry toward $55.50–$56.00 may offer a better risk-adjusted entry.
Close partial profits near $60.00 if momentum slows before final TP.

Using Moving Averages Like a ChaseHow Institutions May Be Using Moving Averages to Align Technicals with Fundamentals
Are moving averages just for retail traders and chart watchers? Not if you're JPMorgan Chase.
While many associate moving averages (MAs) with simple trading strategies, institutional giants like JPMorgan Chase likely use them very differently. Instead of relying on MAs to chase trends, they may use them as confluence tools—where technical signals meet macroeconomic insight, risk models, and long-term strategy.
Here’s how JPMorgan might be using moving averages across their medium- to long-term investments—and what you can learn from it.
📊 1. Moving Averages as Investment Benchmarks
At the institutional level, MAs aren’t just "buy/sell" triggers. JPMorgan likely treats the 50-day and 200-day moving averages as dynamic references that help answer broader questions:
Is this trend aligned with the macro picture?
Is this a real shift, or just short-term volatility?
How do fund flows behave around these levels?
Rather than acting on the average itself, JPMorgan probably uses it to validate investment theses and smooth out the noise.
⚙️ 2. Confluence: Where Technicals and Fundamentals Align
In large portfolios, confluence is king. It’s not just about one indicator—but about multiple factors aligning to strengthen conviction.
MAs might be used alongside:
Macro trends (GDP growth, inflation, interest rates)
Sector momentum (e.g. financials vs. tech rotation)
Earnings growth and valuation models
Liquidity flows and volatility data
When a stock reclaims its 200-day MA and fundamentals improve, that’s a green light. When everything lines up, JPMorgan can move with more confidence.
📈 3. A Probabilistic (Not Predictive) Approach
Institutions don’t deal in absolutes—they deal in probabilities. JPMorgan’s quant teams likely test how often certain MA setups lead to favorable outcomes under different market regimes.
So instead of reacting to a crossover, they may ask:
"How often does this setup succeed, given current economic conditions?"
If the odds are strong, they’ll scale in. If not, they’ll wait or hedge. It’s a measured, data-driven approach to timing.
🛡️ 4. Risk Management and Strategic Timing
Moving averages are also incredibly useful for managing portfolio risk. They offer:
Clarity in volatile markets
Timing cues for rebalancing
Visual structure for entries/exits
MAs help JPMorgan place guardrails around long-term positions—keeping strategy in check while avoiding overreactions to noise.
🔍 Final Thought: JPMorgan Isn’t Chasing Trends—They’re Refining Them
The lesson for investors? Don’t treat moving averages as magic lines. Used well, they become tools of confirmation and control, not prediction.
For JPMorgan Chase, MAs are likely just one piece of a much larger puzzle—blending technicals with fundamentals, data science, and market context to execute with precision.
💡 Pro Tip: You can apply the same idea to your own strategy—use moving averages to validate your thesis, not to drive it. Confluence is the key.

OIL Reaching Crucial SupportOil is reaching an important support in the weekly timeframe. A 50% rise to $83 won't be surprising.

CRUDE OIL FUTURE DAILY CHARTEverything according to plan!!! We see more downside potential for the Oil market that could reach $40 area

Crude Oil: Weakest Setup in Recent Times | Caution Advised🛢️ Crude is showing one of the worst technical setups in recent memory. On the weekly chart , it's trading at a 4-year low , with back-to-back weekly breakdowns , indicating strong bearish momentum.
🔻 If the price breaches the recent support near $55.12 , we could see further downside in the coming weeks. This level will be crucial—holding it might trigger a bounce, but a breakdown could confirm a deeper trend shift.
⚠️ However, it’s important to remember: Crude Oil is highly sensitive to geopolitical and policy-driven moves . Technicals can break down quickly under such influences, so trade with strict risk management .
📉 I'm using the #iSparkIndicator to monitor momentum and breakdown confirmations. It’s currently showing sustained weakness with no bullish divergence yet.
📌 Key Levels to Watch :
Support: $55.12
Resistance: $64.50
💬 Stay cautious and reactive—not predictive. Let the market show its hand.
🔍 Interested in the iSparkIndicator? Check my profile for more info.
#CrudeOil #OilAnalysis #WTI #iSparkIndicator #TechnicalAnalysis #Commodities #SwingTrading

#202518 - priceactiontds - weekly update - oilGood Evening and I hope you are well.
comment: Bears defended the breakout area and kept the market in a bear trend. Bulls tried to print a higher low with a decent bull reversal bar on Thursday. Now what? No idea. Oil below 60 is a big thing and staying below is somewhat low probability, given the past 6 years. The chart is still pretty bearish and if you want to be a bull and look at this, would you be thrilled to buy it at 58? I’m not sure. If you could hold below 53 and add lower as well, sure but as of now, bulls have not done enough to convice me this is a credible bottom.
current market cycle: trading range on monthly tf and bear trend on the daily
key levels: 54 - 65
bull case: Bulls want to keep Thursday the higher low and go up from here. Above 60 they are slightly favored to test 62/64 again but one could also draw another bear trend line from 71.66 to 63.9 from last Monday. So buying here is not favorable, no matter how you look at this chart. Only above 65 do bulls take control again and can test the next bigger bear trend line around 67.
Invalidation is below 54.
bear case: Bears kept the bounce around the breakout area from the W1 low. Now they need to make lower lows to confirm the acceleration of this bear trend. If they fail, this will become fuel for the bulls to test back up to either 67 or even the W2 high at 71.66. My line in the sand for the bears is a daily bull bar close above the daily 20ema. If bulls can get that, I think more bears will give up. Until then, bears are slightly favored, especially below 56.29 to test 54.48 again.
Invalidation is a daily close above 62 and for sure anything above 65.
short term: Neutral around 58. Below 56.29 I think we can do 54.48 or lower and above 62 I expect more upside for 64 or higher.
medium-long term - Update from 2025-04-27: This does look like another bear trap below 60, which was to be expected.

micro wti in wave 4 pullback next wave 5Hello traders, I noted an Elliott wave aggressive bullish wave 1 run with strong bullish candles followed by a complex wave 2 correction then followed by a strong impulse 5 wave structure that I noted as wave 3 at premium. Currently, in a simple corrective wave 4 at the ( green area of interest) I see that wave 4 still is in progress and can potentially finish at the trap of fib.0618 making sure to leave some liquidity behind for later structure manipulation. Noting, that 4wave can not violate wave 2 territory per Elliott waves rules. When wave 4 is completed wave 5, I suggest will resume to grab the above the liquidity see in yellow @ 1 fib extension or more 1.272=(for Elliott wave traders).. note 30 min chart , confluence on 4hr and 12 hr chart

Oil long term downOil
Monthly
Monthly continuation down
Psychological support level 50
Strong 43.5 level
Weekly
Expecting weekly continuation down
R/R high as price is really close to 55 last's month low level
Conclusion
Not a good trade setup
However long term is down maybe all the way to weekly or monthly RSI 30

crude oil now selling pressurehello all,
as per chart & our indicator gives sell signal on chart, below target are given upside red line stop loss.
wait for break out.
please comment with ur no. if u like my analysis.

OPEC at a turning point: what’s next for oil? All eyes are on OPEC ahead of its May 5 meeting as it faces pressure from falling prices, weak demand, and internal rifts.
While some expect a pause in output hikes, the consensus points to continued increases. The group’s decision will be key in shaping oil market dynamics amid trade tensions and fragile global growth.
APRIL PRICE ACTION: TARIFFS, TRUMP, AND TURBULENCE
April witnessed WTI crude oil futures plummeting by 18.6%, marking its sharpest monthly decline since November 2021, as U.S. tariffs and OPEC+ supply hikes dragged prices.
President Trump’s April 2 announcement of 10% baseline tariffs on all imports, with elevated duties targeting China and others, triggered fears of a global trade slowdown. Additionally, China’s retaliatory tariffs on U.S. goods only intensified demand concerns.
OPEC+ exacerbated the selloff by boosting output by 138,000 bpd in April, its first production hike since 2022. The group had initially planned for gradual monthly increases of 135,000 bpd, but the higher-than-expected increase caught the market off guard, intensifying downward pressure on prices.
The cartel followed up with an announcement that it would hike output in May by 411,000 bpd. The accelerated pace of production increases is widely seen as politically motivated, reflecting pressure to align with U.S. interests amid growing geopolitical and economic tensions.
OUTPUT HIKES LOOM AMID POLITICAL TENSIONS AND INTERNAL RIFTS
OPEC+ faces growing pressure to raise output, despite weak demand. Political factors, internal pressure from key members, and a desire to protect market share are driving this shift.
Disagreements within the group are mounting. Kazakhstan, for example, says it can’t cut production and will prioritize domestic needs, continuing to exceed its target. In March, the UAE, Iraq, and Nigeria also pumped above quotas and are pushing for higher limits to support their budgets.
Source: OPEC and IEA
Saudi Arabia appears less willing to support prices with further cuts. Reuters reports the kingdom is prepared to tolerate lower prices to defend market share.
Rising domestic oil use from May to September, due to higher electricity demand, also supports more output.
OPEC+ is also under political pressure to boost output, with analysts suggesting Saudi Arabia and others may fast-track supply hikes at the May 5 meeting to ensure oil doesn’t become a flashpoint ahead of Trump’s upcoming visit to the Gulf.
OIL MARKET STRUGGLES WITH TWIN HEADWINDS: WEAK DEMAND AND RISING OPEC+ SUPPLY
OPEC has cut its 2025 oil demand growth forecast by 10.3% to 1.3 million bpd and trimmed its 2026 outlook by 10.5% to 1.28 million bpd, citing the impact of U.S. tariffs.
Source: OPEC , EIA , and IEA
The EIA and IEA echoed this downgrade, reinforcing expectations of prolonged price pressure amid trade tensions and rising supply.
Source: U.S. Bureau of Economic Analysis
Economic data from major consumers deepens the bearish tone. The U.S. economy contracted 0.3% in Q1 2025, its first decline since 2022, as firms rushed imports ahead of tariffs, disrupting trade flows. China’s April manufacturing PMI dropped to 49, marking its lowest since 2023 despite stimulus measures.
The trade tensions between the U.S. and China disrupt supply chains and increase costs, while slower economic growth in key regions curtails fuel consumption.
With global growth cooling and OPEC+ accelerating output, the oil market now faces a dual challenge: softening demand and swelling supply. The result is a volatile outlook skewed toward persistent oversupply.
HYPOTHETICAL TRADE SETUP
With OPEC+ likely to uphold or accelerate output hikes at the May 5 meeting due to the reasons stated above, WTI remains vulnerable.
Notably, WTI’s implied volatility remains near its YTD highs, and the skew stays deep in negative territory at 5.6, signalling stronger demand for downside protection over upside exposure.
Source: CME CVOL
The 21-day MA remains above the 9-day MA, indicating sustained bearish pressure, while the MACD continues to trend lower despite the May 1 price rebound.
RSI hovers in neutral territory but below the midpoint, signalling weakening bullish conviction.
All these indicators point to fading bullish momentum and sustained downside pressure.
Overall, bearish technicals, persistent oversupply risk, and soft economic data from the U.S., China, and Europe support a short-term bearish view.
Source: CME QuikStrike
With OPEC’s meeting set for 05 May, investors may explore the 05/May ML1K5 Monday weekly options.
This paper posits a Bearish Put Spread using weekly WTI options expiring on 05/May, offering defined risk and reward in a directional play with a 1.1x reward-to-risk ratio.
The long put at USD 61/barrel, and the short put at USD 57/barrel; this sets a breakeven at USD 59.09/barrel. The trade costs a net premium of USD 1.91/barrel (USD 1,910/contract)
The position yields a maximum profit of USD 2.09/barrel (USD 2,090/contract) if WTI settles below USD 57/barrel, and a maximum loss of USD 1.91/barrel (USD 1,910/contract) if it closes above USD 61/barrel.
The chart above was created using CME Group’s QuikStrike Strategy Simulator , which allows for precise modeling and clear visualization of trading strategies under different market conditions.
MARKET DATA
CME Real-time Market Data helps identify trading set-ups and express market views better. If you have futures in your trading portfolio, you can check out on CME Group data plans available that suit your trading needs tradingview.com/cme.
DISCLAIMER
This case study is for educational purposes only and does not constitute investment recommendations or advice. Nor are they used to promote any specific products, or services.
Trading or investment ideas cited here are for illustration only, as an integral part of a case study to demonstrate the fundamental concepts in risk management or trading under the market scenarios being discussed. Please read the FULL DISCLAIMER the link to which is provided in our profile description.

Bullish Harami/ Hammer -Unconfirmed Candlestick PatternThis candlestick pattern lacks confirmation but suggest a bottom may be forming for crude oil. This is likely fully driven by the state of the economy and trade. Any positive news around the economy, geo politics, trade, etc. will likely result in confirmation with a bullish candle and prices could go higher.

Crude oil 4 h time frame 🛢️ Technical Overview (WTI Crude Oil – 4H)
📐 Pattern Formation:
A double bottom pattern is clearly forming, which is a classic bullish reversal structure.
The neckline appears to be just below the $59.00 area.
A breakout above this neckline would confirm the pattern and open the door for further upside.
🎯 Measured Move Projection:
The vertical projection shows a +7.89 USD target (around 12.49% upside).
Measured from the neckline (~$59.00), the projected target is around $66.90–$67.00.
🔍 Key Levels:
Support (bottom of the pattern): ~$56.00–$56.30
Neckline/Breakout level: ~$59.00
Target zone: ~$66.90–$67.00
Resistance on the way up: ~$61.00 and ~$64.50
🧠 Outlook & Bias:
Short- to Medium-term Bias: Bullish, contingent on a confirmed breakout above the $59 neckline.
A break and close above $59.00 would activate the pattern and favor a continuation toward $66.90.
If price fails to break out and falls back below ~$56.00, the pattern is invalidated.
📌 Potential Trade Setup (Educational Only):
Entry: Break and close above $59.00
Stop Loss: Below $57.50
TP1: $61.00
TP2: $64.50
TP3: $66.90

WTI: Break It or Bounce ItIf other cyclical asset classes are rallying like a global recession can be avoided, then why shouldn’t crude oil? Yes, there are reports OPEC+ may increase output again, and we know Donald Trump wants lower prices, but those factors should already be priced in. The true swing factor is demand—and if it’s not about to fall in a heap, why should crude?
We’ve now seen three violent rallies from beneath $57.30, including when the level was established in early 2021. If price were to return to those levels in the near-term, it could offer a decent swing trade. Longs could be established above with a stop beneath for protection, targeting a run back to $60.45, a minor level that acted as both support and resistance in April. If that were to give way, a move towards key resistance at $65.27 could follow.
Another option would be to wait for a sustained push above $60.45, allowing longs to be established on the break with a stop beneath, targeting $65.27. Of the two setups, this one screens as higher risk given how lightly $60.45 has been tested.
Momentum remains with the bears, which normally favours selling rips over buying dips. But in these headline-driven markets, that signal may not carry its usual weight. For what it’s worth, downside momentum is easing for now.
A close beneath $57.30 would invalidate the countertrend bullish setup.
Good luck!
DS

Looking to short CL to continue lowerCL is making a corrective move higher before moving down to the ultimate target of last Daily structure leg down. It retraced to Daily bearish Fair Value Gaps (internal range liquidity zones) which should act as resistance. 15M bearish structure is in Extreme premium.
I'm looking for CL to break down bullish corrective structure on 5M chart and start a final move down.

MCX Crude Oil Hourly PredictionAs shown in the attached chart, MCX Crude Oil performed well under 1 hourly chart always.
Disclaimer:- All the shared views are for educational purposes only. We provide Technical Indicators only for educational purposes. As we are not SEBI registered, there will be no claim rights reserved. Please consult your financial advisor before trading or investing.

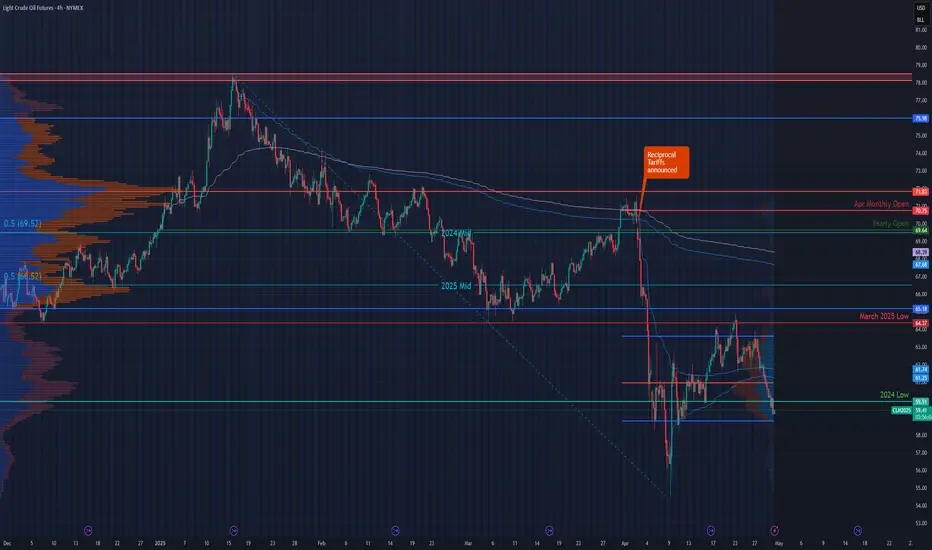
Planning for the Next Trade in Crude OilNYMEX:CL1!
Key Levels – Higher Timeframe:
• 2025 High: 78.56
• Yearly Open (2025): 69.64
• 2025 mCVPOC: 71.83
• Yearly VWAP: 68.41
• AVWAP from Yearly Highs: 67.71
• 2025 mCVAL: 65.28
• March 2025 Low: 64.37
• 2024 Low: 59.91
April 2025 Key Levels:
• April mCVAL: 58.79
• April mCVPOC: 60.94
• April AVWAP from Lows: 61.29
• April AVWAP from Highs: 61.76
• April mCVAH: 63.73
Our previous trade idea played out as expected. With updated levels now in place, we aim to reassess the market context without falling into recency or confirmation bias. These biases often lead to an overly bearish outlook at market lows, especially amid ongoing headlines around trade war tensions and supply concerns. While such fundamentals are important, maintaining objectivity is key.
This leads us to the central question: Is all this bearish sentiment already priced in? If so, why are sellers still dominant?
From a broader perspective, the overall context for crude remains bearish. However, this does not imply an immediate continuation to lower prices.
Currently, price is trading below both the midpoint of 2025 and that of 2024. Additionally, the recent price swing failed at the March 2025 low—an important technical rejection. The 2024 low at 59.91 now serves as key structural support. We anticipate further consolidation within the April 2025 value range, specifically between mCVAH (63.73) and mCVAL (58.79).
We define the area between April’s mCVPOC (60.94) and AVWAPs (61.29 / 61.76) as a "noise zone"—a region where price action is likely to be choppy and directionless. This zone is not favorable for directional trades.
Potential Trade Setup – Range-Bound Play
Example Trade 1: Long Crude Oil
• Entry: 59.91
• Stop: 59.20
• Target: 61.76
• Risk: 71 ticks
• Reward: 185 ticks
• Risk/Reward Ratio: 2.6R
Example Trade 2: Long Crude Oil
• Entry: 58.80
• Stop: 58.20
• Target: 61.76
• Risk: 60 ticks
• Reward: 296 ticks
• Risk/Reward Ratio: 4.93 R
Important Notes:
• These are example trade ideas and not financial advice or recommendations.
• Traders should conduct independent analysis and ensure proper risk management.
• Stop-loss orders are not guaranteed; slippage may occur, resulting in losses beyond predefined levels.
• AVWAP levels are accurate at the time of posting, they may vary as indicator further calculates prices with new volume and price information.
Glossary Index for all technical terms used:
ATH: All time high
VPOC: Volume Point of Control
VAL: Value Area Low
VAH: Value Area High
VP: Volume Profile
AVP: Anchored Volume Profile
C: Composite (prefix before VAL, VAH, VPOC, VP, AVP)
mC: micro-Composite (prefix before VAL, VAH, VPOC, VP, AVP)
AVWAP: Anchored Volume Weighted Average Price
Green Zones: Bull/ Buyers support zones
Red Zones: Bear/Seller resistance zones
Crude oil------sell near 61.60, target 60.00-58.00Crude oil market analysis:
Crude oil has also started to fluctuate recently. Yesterday's daily line finally began to decline. Crude oil is bearish in both the big and small trends. Continue to sell when it rebounds to the moving average. The crude oil pattern is still weak on the daily line. The current suppression position has begun to move down. Crude oil 61.68 is an opportunity to sell. The daily moving average has begun to rush down. Don't intercept it.
Fundamental analysis
Today, we will start to pay attention to the ADP data, as well as PCE data and EIA crude oil inventory data.
Operation suggestions
Crude oil------sell near 61.60, target 60.00-58.00

Oil Price Rebound UnravelsThe price of oil may continue to give back the rebound from the monthly low ($54.46) as it extends the decline from the start of the week.
The price of oil starts to carve a series of lower highs and lows as it snaps the range bound price action from last week, with a move/close below the $59.20 (78.6% Fibonacci retracement) to $60.90 (78.6% Fibonacci retracement) region bringing the 2023 low ($52.24) on the radar.
Next area of interest comes in around $49.10 (100% Fibonacci extension), but lack of momentum to move/close below the $59.20 (78.6% Fibonacci retracement) to $60.90 (78.6% Fibonacci retracement) region may push the price of gold back towards the weekly high ($63.92).
Need a close above $64.70 (61.8% Fibonacci retracement) to bring the $70.80 (61.8% Fibonacci extension) to 72.30 (38.2% Fibonacci retracement) zone on the radar, with the next region of interest coming in around the February high ($74.30).
--- Written by David Song, Senior Strategist at FOREX.com

Crude oil---sell near 63.00, target 60.00-58.00Crude oil market analysis:
The recent crude oil daily line has also begun to decline. Yesterday, the daily line closed negative, and the selling began to decline. Today's idea is to consider selling opportunities near the rebound of 63.00. Crude oil continues to be bearish. No matter the fundamentals or technical aspects, there is no sign of bullishness. Today, crude oil is expected to fluctuate and fall. Don't chase the rebound. We are considering it. In addition, crude oil will also close the monthly line. Pay attention to its monthly line.
Fundamental analysis:
This week is a data week. Starting from Wednesday, big data will be released one by one. In addition, continue to pay attention to the situation of the US dollar and the changes in tariff policies.
Operation suggestions:
Crude oil---sell near 63.00, target 60.00-58.00
