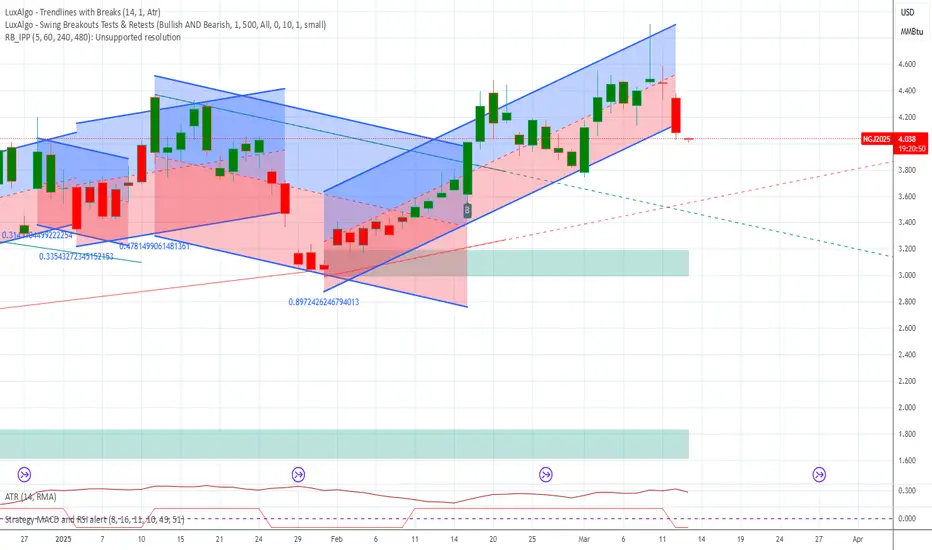
NATGAS What Next? BUY!
My dear friends,
Please, find my technical outlook for NATGAS below:
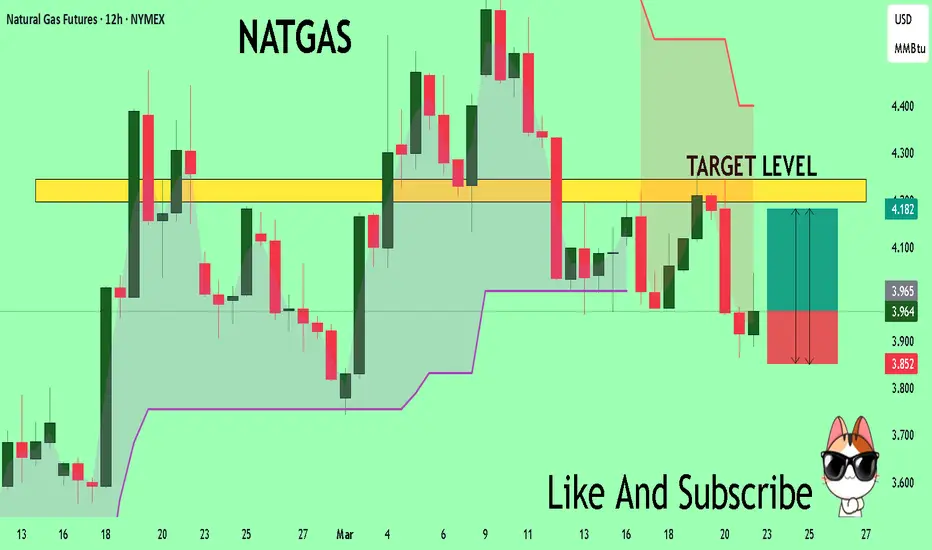
The instrument tests an important psychological level 3.964
Bias - Bullish
Technical Indicators: Supper Trend gives a precise Bullish signal, while Pivot Point HL predicts price changes and potential reversals in the market.
Target - 4.197
Recommended Stop Loss - 3.852
About Used Indicators:
Super-trend indicator is more useful in trending markets where there are clear uptrends and downtrends in price.
———————————
WISH YOU ALL LUCK
JKM1! trade ideas
#NATURAL GAS Demand ZoneIn trading, a demand zone is a price area where buying pressure is expected to be strong, potentially causing the price to reverse or bounce higher. For Natural Gas, identifying demand zones can help traders anticipate potential buying opportunities.

#NATURAL GAS Supply ZoneA Natural Gas Supply Zone refers to a designated area or region where natural gas is extracted, processed, and distributed to meet energy demands. These zones are critical hubs in the energy supply chain, encompassing production facilities, pipelines, storage units, and distribution networks. They play a vital role in ensuring a stable and reliable supply of natural gas for residential, commercial, and industrial use.

NG1! NATURAL GAS SHORT TERM TARGETNatural Gas Price Forecast: Rises to Five Day High
Natural gas strengthened on Wednesday and reached a five-day high of $4.25. The high for the day was a successful test of resistance around a trendline
Following a breakdown from the trendline last week natural gas consolidated in a relatively narrow four-day price range, largely below the trendline and the 20-Day MA.
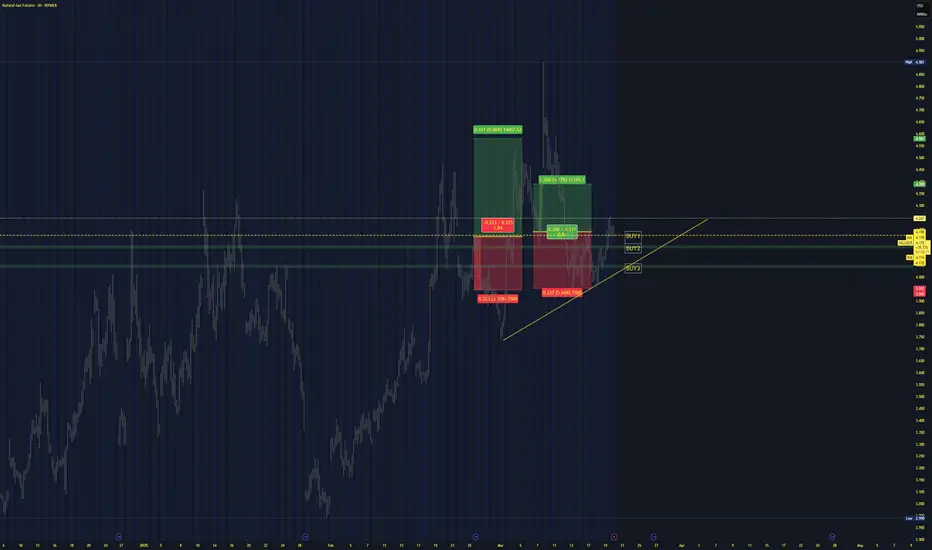
Short term entry and targets
We can chose ,because of volatility and high uncertainty,tariffs,news... between 2 profit targets
If the 1st profit target hits,and NG reverses,possibility 1 to take profit
If it passes through, we take profit at 2nd target.
Entries:
In case to entry currently Buy1
If pullback Buy2
If pullback deep Buy3 level.
Alternatives:
Entry 1 Buy1
Entry2 cover
Entry3 Cover2
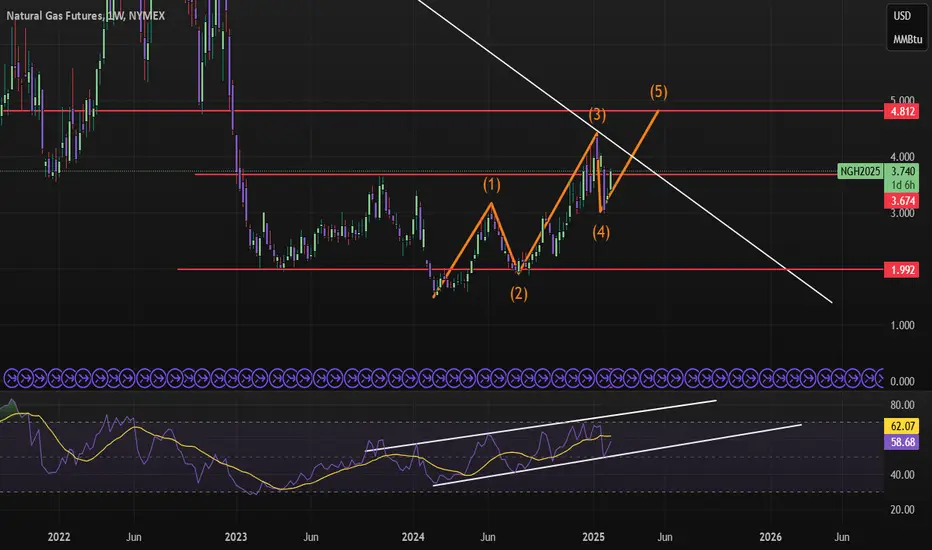
NG long termwell, gas on charts is looking quite bullish I would say.. maybe it's on fifth EW impulse? RSI is on bullish move, nicely in uprising channel and last week it have retested 50%. Can't say what future will brings but so far I'm buying dips, at least DT I would like to see.
#NATURAL GAS (Supply Zone)In technical analysis, a Supply Zone is an area on a price chart where selling pressure is expected to be strong, causing the price to potentially reverse or stall. This concept is often used in trading strategies to identify potential areas where price might decline.

Nat Gas Report: 3/16/25 - Pre Summer outlook
(scroll chart for info/data/charts. Info located between 2.200-5.500, 2019-2025. Sorry for the extra work!)
The weekend calls paid off. I closed my 4.50 calls Monday AM, when the price failed to break the 4120 level. When the price popped, I entered a set of 4.50 puts which I closed this morning when the price approached the 4000 level. April has immediate support at the 4000 psychological level followed by the 3955 low of last week, an area tested twice before rallying. So, 4000 is supporting the price structure. This morning as the price struggled at the 4170 level, I entered my short, knowing that support sits at 4000. Once the price bounced around the 4030 level I again enter at block of four calls at 4.50, but on the May contract. The April contract is too dangerous to hold longer than a day due to the Greeks of the option, and the uncertainty of Trump. So, I now have a true strangle with a block of calls at 4500 and a half block of puts at 3300, on the May contract. I am thinking that I may close my puts if the price breaks below the psychological support of 4000/3950 on the April, and there is velocity to the down side. I am expecting that May should make it back to the resistance level 4320-4350 and back up to the 4500-4550 level.
Tomorrow Trump and Putin and speaking and there should be some news about the proposed peace plan. My belief is that Putin is going to stall for more time, but the big test is if Trump will make good on his threats of banking sanctions! That is one of the reasons I am taking the hedge with the strangle. Strangles are great for high volatility. But, again, we will see the price react probably before the news hits! So big spike up rumors of no peace deal, big move down more rumors of peace.
I do believe that we will see price move back to the higher resistance levels in May, due to production not keeping up with demand. There is not much wiggle room in the availability of supply, due to the low number of rigs pulled out of the field last year, and the low number in the field this year (check 3/13 post for info on rig counts).
Supply/Demand
Even with weak demand, storage remains tight compared to historical averages. The latest EIA report showed a larger-than-expected withdrawal of 62 Bcf for the week ending March 7, pushing inventories 11.9% below the five-year average. While this helped stabilize prices briefly, it has not been enough to drive a lasting uptrend.
On the supply side, Wood Mackenzie estimated Lower 48 production at 104.9 Bcf/d Monday, versus a weekend average of about 105.5 Bcf/d. The about 600 MMcf/d drop was attributed mainly to Pennsylvania amid maintenance on Empire Pipeline Inc. Lower-48 dry gas production remains steady, averaging 107.1 Bcf/day, a 4.6% year-over-year increase. Total demand reached 77.0 Bcf/day, up 5.7% from last year. According to Wood Mackenzie data, LNG demand continued to hover around 16.0 Bcf/d on Monday.
Additionally, after an uneventful 2024, LNG export demand has surged to new record highs as the new Plaquemines facility has rapidly ramped up volumes. Feed gas demand has repeatedly topped 16 BCF/day for five days in a row, including yesterday when flows were right at a new record high of 16.53 BCF/day, up +3 BCF/day year-over-year. Today’s feed gas demand was in at 16.38 BCF/d. Importantly, exports will continue to rise this Summer and Fall, potentially reaching 17-18 BCF/day, up to 5 BCF/day higher year-over-year, essentially countering the gain in supply. Along the same lines, while gains in natural gas production are fueling the large gain in year-over-year supply as discussed above, investors speculate that continued diminished drilling activity and less productive wells will ultimately lead to little production growth the rest of the year. As a result, the year-over-year gain in exports could rise while supply gains are narrowing, leading to a quickly tightening imbalance heading into the next withdrawal season. HH Spot was up another 22.5 cents today, signaling the demand for LNG feedgas. Which is helping to keep pressure on HH future contract. Cheniere Energy Inc. said Monday that the first train at its CCL expansion has been completed. It is the first of seven mid-scale liquefaction trains the company is adding at the facility.
Mexico demand has also been solid. Mexico imported 6.679 Bcf/d of natural gas via pipeline from the United States on Thursday. South Texas flows accounted for 4.408 Bcf/d, according to NGI calculations. West Texas flows across the border into Mexico were 1.549 Bcf/d. Wood Mackenzie’s 30-day range for cross-border flows was 6.2 Bcf/d as of Wednesday. Average U.S. pipeline exports to Mexico this month are 6.59 Bcf/d, according to NGI calculations, on track for a record month.
The weather wild card
The models are now seeing the reaction to the atmospheric influence of the SSW event. The AO and the NAO are now predicted to go negative after this coming work week. This is being telegraphed in the models printing colder and adding more HDDs. It is my belief that we will continue to draw from storage up until the second week of April. This is the time of year where storage begins it injection cycle. This week is the official end to the withdrawal season, and when calculations are begun for the upcoming injection season before next winters withdrawal season. We are currently at 1.7 TCF in storage, second only to 2022. The current industry projections currently put us 200 BCF below 2022’s injection season. This is being influenced by the greater overall demand in LNG exports, exports to Mexico, and general power demand. And the lack of new production due to lack of drilling activity the past 12 months and the lack of pipeline infrastructure due to regulatory issues left over from the Biden Administration. The upcoming summer forecasts are predicting a hot summer in the south-central US, where NG storage is at 16.8% the 5-year average and the lowest in the 5-year period! This has a big impact on LNG production, Mexican exports, and most of all the main contributor to the HH spot price! The summer forward price strip reflects this with an average price of 4454. The most recent EIA STEO forecast predicts Henry Hub price will average around $4.20 per million British thermal units (MMBtu) in 2025, 11% more than last month’s forecast. This is price is not reflected by last week’s price spike to 4950, and the expectation is the next report will revise prices even higher!
The current SSW event is happening during a period of the year where the days are longer and warmer. So, there is no expectation of any drastic events that should spike the price, like a Trump press conference on Tariffs! But the expectation is steady pressure on the storage numbers through the shoulder season, and the dry hot weather that is associated with the months that follow such an atmospheric event. From past years, we know that the month of May following SSW events, are very warm in the central part of the US. A very good indicator for increased demand. As such the south-central US is currently under going a serious drought, which should aid in the increase demand for cooling. As the lack of moisture in the ground will aid in daily night time temperatures exceeding historical normal.
Demand on top of demand on top of stagnant production is a good sign for a similar set up to 2022. I am not predicting 2022 types of pricing, just a steady increase of pricing going into the US summer season. 2022 pricing spiked up to 64% of the yearly opening price. 2025 is currently up 29% for the year. 2022’s price highs were during the months of June and late August. I do see such a situation forming now, like 2022. But, again, Trump can Trump the Trump! So, this analysis is based only on my fundamental outlook for the next eight weeks, or two contract cycles. Since I am currently trading the April contract, I am only beginning to develop a strategy for the shoulder season and will trade accordingly, based upon the market fundamentals and the market pricing dynamics.
Key levels I will be watch include support beginning at 3950-4000, 3875, and 3685-3730. My belief is that if the price breaks the 3875 level, it could get very ugly, very fast with all the longs piled into the market. There are many, many long positions that entered the market after the 4000 price was broken and I could foresee numerous margin calls and possibly mass liquidations. But to the upside I am looking at resistance beginning at the 4170-4200 level. From there 4290-4320 and 4430-4460. If there is velocity up to the prior gap, I can see trying to reach the very important level of 4750. Which by the way has a great deal of importance from the double peak form the previous highs of the last great swing. So, good fortunes and happy trading.
Keep it Burning!

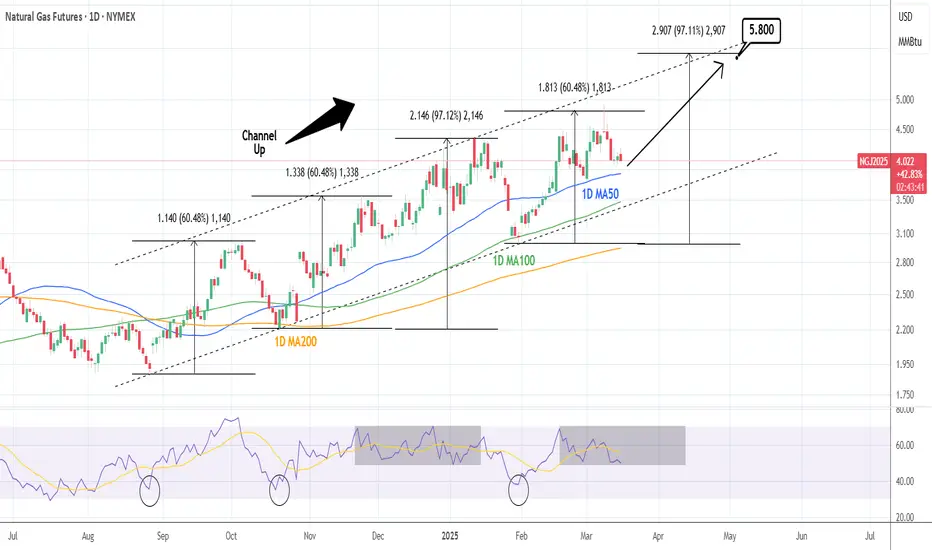
NATURAL GAS: One more technical push.Natural Gas is neutral on its 1D technical outlook (RSI = 49.489, MACD = 0.098, ADX = 23.222), which is the ideal buy opportunity inside its 8 month Channel Up, as long as the 1D MA100 holds. The last HH peaked at +97.12% before pulling back to the 1D MA100. The trade is long, TP = 5.800.
See how our prior idea has worked out:
## If you like our free content follow our profile to get more daily ideas. ##
## Comments and likes are greatly appreciated. ##
Natural Gas | Oil | Dollar | Silver | Gold Price ForecastPrice Action, Pattern, and Trend Forecast |
Natural Gas | Oil | US Dollar | Silver | Gold Price Forecast

Natural Gass Short IdeaNatural Gass is likely to continue its sell of based on fundamental conditions but it can pull back so short only after the breakout of previous LL

NATGAS Trading Opportunity! BUY!
My dear friends,
Please, find my technical outlook for NATGAS below:
The price is coiling around a solid key level - 4.089
Bias - Bullish
Technical Indicators: Pivot Points High anticipates a potential price reversal.
Super trend shows a clear buy, giving a perfect indicators' convergence.
Goal - 4.280
Safe Stop Loss - 3.977
About Used Indicators:
The pivot point itself is simply the average of the high, low and closing prices from the previous trading day.
———————————
WISH YOU ALL LUCK

Nag Gas Midweek Recap: 3/13/25
$5.00 looked so close , but now so far! As predicted the market came to its senses and reverted back to some fundamental pricing this week. Although one tweet from Trump and who knows? I better finish this post and get it posted before he strikes again, or I might be at the drawing board before you know it. For the first time in several months, NG prices were not matching weather trends. However, that changed over the past few days as prices plunged as weather trends and the models printed warmer. NG prices finally reacted sharply lower on fundamental news and lack of Trump-o-nomics. The run up in prices has aided in resetting of fundamental levels of pricing. The upper price for the 2025 NG season has been reset close to the 5000 level, more importantly, the long term double top formation in the 4700-4730 range that has been in place since early in September 2022 held and continues to serve as important resistance for the prompt month. One potential technical implication from the quick price surge late Sunday is it has effectively shifted Fibonacci Retracement levels higher. Key 38.2% retracement now exists at 3984, up from 3875, effectively making $4.00 a bit of a stronger support level. So too does the middle of the current 20 day-Bollinger Band currently sitting at 4128. Yesterday was the first fall below the middle band (20D SMA) since February 7th and there has not been an open and close day below it since January 31st.
As for lower technical levels I am watching, the channel trend at 3908, the swing low at 3742, the 50% retracement level at 3702, and the 50D SMA at 3644. Again, I believe we are in an overall bullish pattern. But I will be looking for these support levels for the turn around in price and the beginning of a move higher. I have been discussing my thoughts for the reasons for the move higher for a bit now. But I suggest caution with the Trump uncertainty in the news. The next round of tariffs come into play the first week of April, and with Ukraine and Russia hammering out a peace deal, I am keeping my investing window close. I am only looking week to week for the time being and suggest you do also. We learned this past weekend that fundamentals will be Trumped by Trump every time. For the remainder of the week, I am playing this market to the short side. I did exit my puts last night when the price dropped below 4000. I waited until the report and entered another block of puts. On a purely, short term fundamental basis, I do not see any reason for the market to react and pressure prices higher. I will not plan on holding any large positions over the weekend, due to the geopolitical and tariff uncertainty. But I will take a small strangle, which I will post before the end of the day tomorrow.
I do see some encouraging signs of the coming colder shift in the pattern. Europe is now forecasting colder weather for the next 10 days. A good telegraph for North America. The SSW is finally beginning to show its signs and I believe by early next week the weather models will begin to see it also. The major long-range teleconnections, the AO/NAO/EPO, are modeling colder day 10-40. It is now just a matter of wait and see. The good thing about the recent run up in price is that we are not going to need bitter cold to start the price to rise. We are just going to need below average temps to keep the shoulder season as short as possible. This will keep the price in a bid mode to refill storage. The other factor about past SSW events in the month of March, is that the tend to have very warm Mays, which will put a jump on the US cooling season.
LNG exports continue to show historic production. This week, in Houston, TX, CERA Energy Week conference was held. Industry majors continue to reinforce the bullish nature of the LNG, data center buildouts, and increase in power generation in the US. The main take away from the conference is the one thing that Trump is doing for the NG industry, is cutting red tape. More that 20 BCF of LNG export capacity was approved by the FERC this week, with expedited permitting. The once dead Continental Pipeline is in talks to restart permitting, and most of the steel needed for the construction of said projects have been pre bid, with pre tariff pricing already in place. The demand is there, and the gas is in the ground. There is other bullish issue such and storage continuing to drop. The shut down of 8 GW of coal plants this summer the now talked about warm summer being forecasted. The U.S. Energy Information Administration researchers calculated U.S. natural gas rigs decreased by 32%, roughly 50 rigs, between 2022 and 2024. The majority of that reduction occurred in the Haynesville Shale and Appalachia Basin, which have helped supply the growing demand for feed gas from Gulf Coast LNG terminals during the same period. Both regions declined by a combined 21 rigs last year as natural gas prices continued to crater amid surging oversupply and the pull of LNG demand from Europe.
So, for the immediate future, keep an eye on those lower support levels. Pricing will begin to move higher sooner rather than later. May is not too far off, and the cooling season is about to begin soon in the southern US.
Keep it Burning!

For elenaecHead and shoulder pattern. Combine this with peace between Ukraine and Russia. Hmm could work out. Yolo

#NATURAL GAS Demand ZoneA Natural Gas Demand Zone refers to a specific price level or area on a chart where the buying interest in natural gas is significantly strong, leading to a potential reversal or pause in a downtrend. This concept is commonly used in technical analysis by traders to identify key levels where the price of natural gas might find support and reverse upward.

NAT GAS ShortNG1! short on regression break - the future roll short is +1.3% per a month
I am not taking this trade.
Naturalgas Buying Opportunity - Ultrashort termDate- 12-march-2025
Naturalgas Looking Good For buy for 2-3 day for 15-20 point with stop-360 CMP- 363 . It will move upward from CMP if Buyer Sustain Price Above CMP.

Nat Gas Update 3/11/24: Redundantly redundant!
(Chart is the price of NG1 to USO, inlay is 15 year average WTI price, from Dec 15 – March 15, last 15 years)
These past weeks I have been discussing two major issues. One was the upward momentum of pricing going into the shoulder season, due to several effects. The other is a Sudden Stratospheric Warming (SSW) Event (I have nothing more to discuss about this issue. As of now it shows up March 20th-April 15th or it does not. You can read my past ideas and watch the videos for explanations.). I did address the Trump tariffs back on 2/10/25, indicating that Trump is more bark than bite. Maybe this needs a bit more!!!!()
But it now seems that the market is just as uncertain to this barking dog, vs afraid of the bite he can inflict. The one thing the market hates is uncertainty. It can take bad news, in stride. Being able to hedge options and reposition assets to minimize losses and see new avenues of opportunities. But Trump’s on again, off again tactics are destroying market confidence along all fronts. I believe most informed market analyst have been pointing out the fundamental reasons that I have been discussing, for a strengthening market this year (which I will address tomorrow). The four horse men are, storage, LNG exports, higher energy demand, and low rig counts. The EIA has increased the HH monthly future price every month since December, in their monthly STEO report. The has not been any uncertainty from producers in showing restraint from the lows last summer. This past week’s quarterly conference calls form the NG majors, have continued to strengthen their resolve for not oversupplying the market once again. There are only a few producers that have signaled their intent to increase rig count, and by modest amounts.
The incredible increase in price these past 8 days were influenced by Trump. His tariff rhetoric beginning with the lack of any deal with Mexico and Canada after the one-month suspension of the January tariffs. Only to be walked back later in the week, then again, walked back further for provisions to Corporations that have been compliant with the previous USCMA trade agreement. The investing community again will wait until April 2nd to see what new chaos will ensue, only to be rescinded and spun again. The European issue, with Trump supporting Russian plans for a negotiated peace deal, followed by threats of sanctions on Russian banks. We should start to tie the price of the Dutch TTF to which way the wind blows in favor of Ukraine or Russia. Talk about uncertainty!!! So if you take out fundamental, there is only one option left, and that is pure speculation. My belief, as others are, that this present market has suspended any formal ties to market fundamentals and structure and pricing.
The most recent COT report by the CBOE shows that the number of long vs short positions in the market are the highest since July 2023. The ration of longs to short have not been this high since Summer of 2022!! Not saying that this is where we are headed. Just pointing out that managed money sentiment is and has been quite bullish for about three weeks now. Getting more bullish by the week. This past weeks price move on Tuesday was due to a large fund liquidating, which possibly has dried up a large majority of the near term shorts in the market. This past Sunday night, a lot of buy stops above the opening were met last in thin night trading, a big trader or fund blew up (margin call liquidation), or a combination of both. I don’t see any good fundamental or technical reason for gas to have gotten to those levels, which means people were probably buying up there because they had to, not because they wanted to.
But what does that mean about forward pricing? Well, it was inevitable that we would see prices at these levels this trading season. But I think very few were prepared to see the price move so far, so fast. Why, we ask? And the answer just might lie in the seasonal Oil/NG trade. Most winters, with a healthy supply demand balance, the price of NG typically begins drops into the shoulder season starting sometime around the end of the year. Not exactly the end, but sometime around the end. The chart provided shows the average price of WTI for the past 15 years, and we can see that from mid-December to mid-march the average price of WTI increases. Energy traders trade energy. We trade, oil, gasoline, heating oil, NG, distillates, etc… There is a direct correlation to the drop in NG and heating oil to the increase in WTI/Brent. But not this year. This upward trend in prices has to do with refiners locking in pricing for the upcoming gasoline cycle. Not going to get into it here. But the short end. NG down, Oil up = normal seasonal trade. But this year. Oil down, NG up. I believe this is only speculative in nature, due to market dynamics and a need to park capital. See my charts above of the historic relationship vs the last three months.
So, we have a group of traders who specialize in energy, who shift allocations around all year, Spring – Oil, Summer – Gas, Fall – NG, Winter – Diesel/Heating Oil. The pattern is repetitive for allocation unless there is some kind of disruption. ENTER TRUMP!!!! There is no doubt that we will see $5.00 NG this year, but I just do not think it has staying power. My belief is that in the short term, we will have a pullback in prices, to a fair adjusted value of somewhere in the $3.90 - $4.35 level until the injection season begins. I would take every opportunity to buy pullbacks in prices below the $4.40 level. The next big energy trade will be Oil again, for the COT report shows the seasonal longs in the market to place orders for the upcoming summer driving period. They are taking long positions to have crude at the refineries in time for the summer blend to be produced. I look at the end of march each year in a bump up in Oil prices, until about April 15th (a nice once a season trade I enjoy). Has followed this path 17 out of the last 22 years, and I have no reason to not believe this will happen again. So, energy traders are going to need some allocation for the upcoming April contract in WTI, to meet May delivery, for Memorial Day gas blend. So, sell what they are running up! NG!
Again, this is a very volatile time. I do not recommend this type of trading for the novice, but since Friday’s close I have a strangle in place. Which is two OTM option position. I placed a call at $5.20 and a put at $4.05. I closed my $5.20 call Sunday night not too long after the price settled back from $4.90. It was a nice unexpected position to close. I reentered a $5.00 call again before the market closed today. I will play the volatility back and forth until fundamentals return. Tomorrow I will update the fundamental for the upcoming 8 weeks or so. Not that it matters with this Trump wrecking a pretty sure thing! But we must be ready before the other do. That is how we stay on top of our game.
Keep it burning!

Cheaper GASHead and shoulder pattern. Combine this with peace between Ukraine and Russia. Hmm could work out. Yolo

GasNatural Gas
Key Points in this Chart :
Bearish Channel
Break of Structure
Elliot Waves
Fibonacci Level - 161.8% / 200.0%
Support Level

NATGAS BULLISH BREAKOUT|
✅NATGAS is trading in an
Uptrend and the price made
A strong bullish breakout
Of the key level of 4.400$
Which is now a support
So we will be expecting
A further bullish move up
LONG🚀
✅Like and subscribe to never miss a new idea!✅

Gold | Oil | Dollar | Silver | Natural Gas Price ForecastFutures Commodities Forecast | Gold | Oil | Dollar | Silver | Natural Gas Price Forecast
COMEX:GC1! NYMEX:NG1! NYMEX:CL1! COMEX:SI1!

NATGAS Set To Fall! SELL!
My dear followers,
I analysed this chart on NATGAS and concluded the following:
The market is trading on 4.401 pivot level.
Bias - Bearish
Technical Indicators: Both Super Trend & Pivot HL indicate a highly probable Bearish continuation.
Target - 4.316
About Used Indicators:
A super-trend indicator is plotted on either above or below the closing price to signal a buy or sell. The indicator changes color, based on whether or not you should be buying. If the super-trend indicator moves below the closing price, the indicator turns green, and it signals an entry point or points to buy.
———————————
WISH YOU ALL LUCK

NATGAS: Bearish Continuation & Short Trade
NATGAS
- Classic bearish formation
- Our team expects fall
SUGGESTED TRADE:
Swing Trade
Sell NATGAS
Entry Level - 4.401
Sl - 4.546
Tp - 4.137
Our Risk - 1%
Start protection of your profits from lower levels
Disclosure: I am part of Trade Nation's Influencer program and receive a monthly fee for using their TradingView charts in my analysis.
❤️ Please, support our work with like & comment! ❤️
