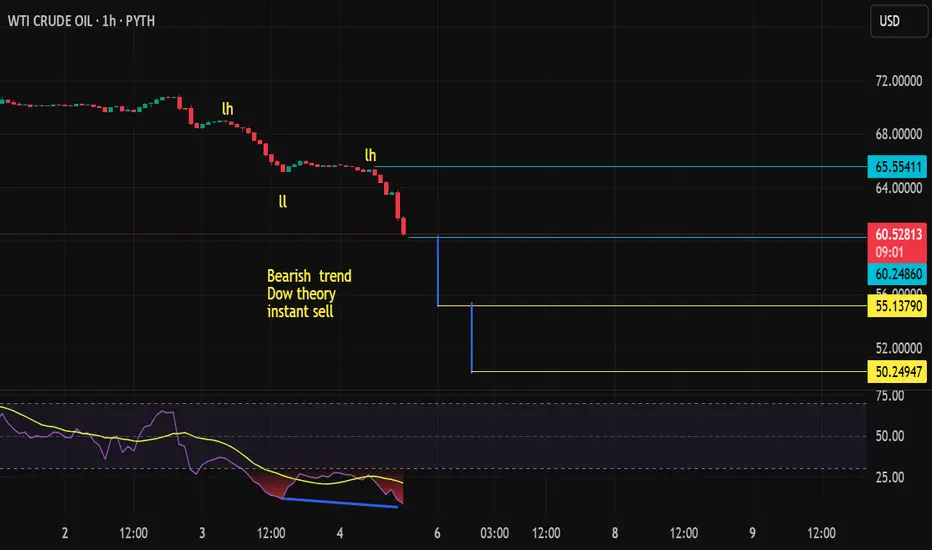
Crude bearish after minor retracementCrude has fallen over 14% in the last two trading days; can it go another 5-10% down from here? Many analysts seem to think so. However, a retracement cannot be ruled out as well. It needs to be seen will there be a minor retracement before the next leg of bearishness or direct fall.
MCL1! trade ideas

CRUDE - WEEKLY SUMMARY 31.3–4.4 / FORECAST🛢 CRUDE – 18th week of the base cycle (28 weeks). We are in the 2nd phase, clearly bearish. On March 23 I wrote:
"The current base cycle cannot yet be called bearish as it hasn’t broken the starting point. The next key extreme forecasts for crude are March 27 and 31."
👉 Now this base cycle can be considered bearish. Even though the short position from March 27 was stopped out with a planned loss, the extreme forecast of March 31 provided an opportunity to open a new short position. This is a rare case of two closely spaced extreme forecasts triggering back-to-back. These forecasts were issued specifically for crude at the beginning of the year as a window from March 28–31.
⚠️ It looks like my bearish forecast is being confirmed, as outlined in the summer 2024 crude post. The Jupiter–Uranus conjunction is working precisely. All of this resembles the 2010–2014 setup. The previous 4-year crude cycle began in spring 2020 and went sideways from fall 2022. It seems a new 4-year cycle has already started, and its beginning is very weak — much like fall 2012. There’s a high probability this will be a bearish 4-year cycle ending closer to 2028. The next universal extreme forecast is on April 7. The next crude-specific extreme forecast is on May 5.

Oil Futures short: Breakdown of descending triangleThis is the breakdown that I had discussed in my earlier idea on the same product. I had used futures this time because this is the product that most professional traders used for trading oil (and really because it's what my friend uses).
The stop is set slightly above the breakdown price.
The take profit is set at 1-1 target from the most recent peak to the breakdown.

What next for WTI ?Although we had a strong up move in oil last week we remain well within last years range. we still a need above $76.50 area to pose a threat on higher prices towards $85/90, otherwise we sink back into the range of the last 14 months, similarly a close below $63.75 will see the deeper move lower.

Crudeoil Short OpportunityFundamental : US Trariff rates Affected UsOil Market . Demand for crudeOil Will decrease in uncoming months.
Technicals: US oil Broke Multiple year support zone. Possible Downside move in Crudeoil MCX will be RS3500 from CMP . Strick Stoploss- RS6200.

Crude Oil Broke Strucutre to the DOWN Side!here we have a pretty simple trade, price action on the daily has finally broke structure to the downside.. this week i'll be looking for sells, you can either enter on the open or look for imbalance GAPS for a slightly better entry on any PULL backs... i'll be adding additional entries as we break the next structure... the structures i have drawn up with the blue dotted lines are areas to target and also wait for the break down of that support area!!!!
conclusion - simple trade keep it simple and don't over risk and over trade!

Crude Analysis After huge fall.I have analyzed the crude with Gann method of price. I have also used trend and candlestick pattern. Then reached to this conclusion. Target is apple. And other level to watch for entry.

Tactical Setups & Opportunistic Fades
Asset Focus: Crude Oil (WTI)
Setup Type: Bull Trap Reversal with Structural Decompression – Tactical Short Bias
⸻
Setup Overview:
Crude Oil has transitioned from an emotionally driven rally into a reactive phase of structural decompression. The advance was underwritten by geopolitical risk and inflation narratives, but failed to sustain as macro catalysts reversed. The recent U.S. tariff announcement and OPEC+’s unexpected supply adjustment have directly challenged the bullish framework, forcing a revaluation of near-term demand and policy trajectory.
The result: a rejection event that is less about price and more about positioning. The crowd narrative cracked — and the structure followed. What unfolds now is not collapse, but reset.
⸻
COT & Sentiment Snapshot:
• Leveraged funds expanded long exposure aggressively into strength — classic trend-chasing.
• Recent positioning data shows contraction in net longs, signaling early-phase exit behavior.
• Open interest has dropped in parallel with price — a sign of liquidation, not new conviction.
• Commercial activity likely neutral-to-hedging, providing natural resistance into strength.
• Sentiment rotated quickly — from supply fears to demand caution — validating the trap thesis.
⸻
Market Structure & Technical Breakdown:
• Structure confirms a failed continuation — rejection at a known inflection zone undercuts trend integrity.
• Rally occurred without foundational support — gaps beneath price reflect structural imbalance.
• Price has rotated back through key pivots, invalidating prior momentum.
• Thin, untested zones now offer a path of least resistance if pressure continues.
• Current structure suggests rotational or decompressing behavior rather than directional clarity.
⸻
Behavioral Finance Layer:
“When the justification for a trade becomes a headline, the trade is already crowded.”
• Market participants had fully embraced oil as a geopolitical and inflation hedge — a one-dimensional thesis.
• The introduction of U.S. tariffs and the OPEC+ supply shift challenged that belief in real time.
• The rejection was not just technical — it was narrative failure.
• Emotional capital is now unwinding. The next phase will not be fast — it will be unsure.
⸻
Reflexivity Risk Model:
• Phase 1: Risk-driven narratives drive flow into the asset (conflict, inflation, supply tightness).
• Phase 2: Price rise validates the narrative — conviction deepens, flows accelerate.
• Phase 3: Macro catalysts shift (tariffs, supply bump), undermining belief system.
• Phase 4: Narrative fails — positioning begins to unwind, structure decompresses under pressure.
⸻
Strategic Stance:
Hold a tactical short bias grounded in structural rejection and narrative breakdown. No immediate directional call is required — the edge is in recognizing the psychological unwind already underway. Until a new belief structure emerges, the path forward remains governed by residual flow and fading conviction.

Crude Oil update in weekly chartThere is nothing I can add to my last published idea of CL1 except the pattern of y. It make sense that wave y makes a flat instead of zigzag which I guessed. Anyway, there is no matter and I am waiting for a reliable correction.
Thanks

CL Swing Long Trade idea based on supply and demand, intermarket analysis and cross market valuation. Following a structured approach with clear entry, risk management, and confluence factors.

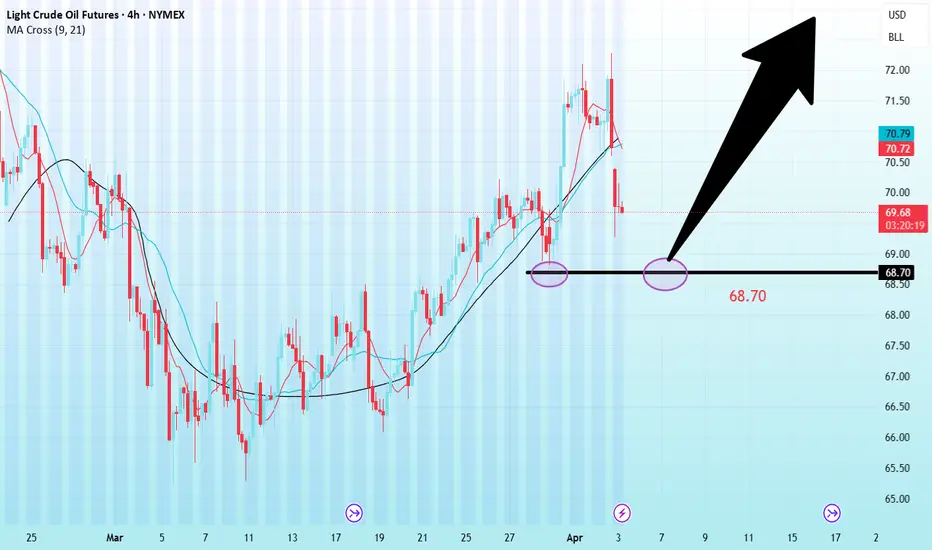
Crude oil-----buy near 68.90, target 69.90-72.00Crude oil market analysis:
Yesterday's crude oil daily line showed continuous tombstones, which was suppressed near 72.00. Today's idea is to continue to look at the rebound in the short term and pay attention to the support near 68.70. This position is a buy rebound. We will wait for opportunities in the Asian session. Crude oil has begun to move on a weekly trend. We need to pay attention to this week's closing to determine whether it will start a weekly trend in the future.
Fundamental analysis:
Trump's midnight tariffs caused the market to tremble again. In addition, ADP rose sharply, with a result of 155,000 people, 80,000 people in advance, and 115,000 people expected. The bulls still pulled up under such a big negative situation.
Operation suggestions:
Crude oil-----buy near 68.90, target 69.90-72.00
Nice Trade Buying the LOW OF THE DAY on Crude Oil futures Nice Trade Buying the low of day on Crude Oil futures , you can see the execution to the left, should I close it? (Yes a paper trade) ( Just saw it doesn't show execution)

Crude oil---Buy near 70.60, target 71.90-76.00Crude oil market analysis:
Today's crude oil is still bought at a low price, and short-term bulls have started. Yesterday, gold fell in the US market, but did not fall in the Asian market, but repaired at a high level. The strong support of the daily line has reached 70.00, and the small support is 70.50. Today's idea is to find buying opportunities above 71.50. The daily moving average of crude oil is lined up, and there is still a lot of room for growth.
Fundamental analysis:
This week is a data week. Today, pay attention to the ADP employment data, which is the pre-agricultural data.
Operation suggestions:
Crude oil---Buy near 70.60, target 71.90-76.00

Oil Chart Ready for Price ReboundWith the price being squeezed in this support area, it looks like we are ready for a price rebound in oil. I see price ceilings of $120 and $200 for oil.

OIL - CL - Long scalping OIL - CL - Long scalping
If price break resistence zone we can have an new long wave to complete the 3° wave

Long Next Week: Crude Oil Set for Potential Price Recovery
- Key Insights: Crude oil sees potential upward momentum with prices trading
above the 8-day moving average. Market sentiment favors short-term recovery
despite mid-level volatility due to geopolitical tensions and supply-demand
dynamics. Analysts emphasize crude oil's undervaluation and opportunities
due to supply constraints and potential oil production peaks by 2025.
- Price Targets: Next week targets aim for a recovery from the current level.
Tight stops and returns provide a trading framework.
- T1: $71
- T2: $72
- S1: $67
- S2: $66
- Recent Performance: WTI crude oil is trading around $68, with predictions
suggesting a pullback to $67 before potentially rising. Trading above its
8-day moving average suggests persisting upward momentum, pending market
movement. Market volatility exists due to fluctuating demand-supply dynamics
and geopolitical factors, with price support at $64.75 and resistance around
$70 to $73.50, indicating critical levels for potential trends.
- Expert Analysis: Analysts highlight the undervaluation in commodities,
including crude oil, suggesting investment opportunities as the energy
sector benefits from supply constraints. Expectations exist for peak oil
production by 2025, which could lead to long-term market shortages and
volatility. Companies like Occidental Petroleum remain sensitive to price
variations, focusing on debt reduction and dividend increases.
- News Impact: Geopolitical tensions related to Russian, Iranian, and Venezuelan
oil could pressure supply chains and affect price stability. The move
towards renewable energy continues to reshape long-term demand; however,
robust demand is anticipated until major shifts occur. China's crude oil
strategies will significantly impact global supply and price alignment.
Monitoring these developments is crucial for understanding future price
trajectories in the crude oil market.

#202513 - priceactiontds - weekly update - wti crude oil futuresGood Evening and I hope you are well.
comment: Bulls continued and surprised a bit with the follow-through. 3 consecutive bullish weeks now and market has touched 70 multiple times. 70-72 is my neutral target while leaning bullish below 68. Volume is atrocious but market is free to do whatever. Could see a retest of 66 as well as going higher for 72. Absolutely no opinion on this or interest in trading, other than small scalps. Look at the weekly tf and tell me how obvious everything is, be my guest.
current market cycle: trading range
key levels: 65 - 72
bull case: Bulls produce decent tails below daily bars and keeping the market above the daily 20ema and 69. Right now they have taken somewhat control of the market after many weeks of selling, likely due to bears being exhausted. Only a daily close above 70 would change my assessment though. Sideways is more likely for me and I have no bigger interest in buying at 70 when it could be the high of a potential trading range 65 - 70.
Invalidation is below 65.
bear case: Bears sold the market relentlessly for 2 months straight and do seem exhausted. Right now they want to keep 70 resistance and since this is the first decent bounce the bulls got, the odds of this going much further up are low. It’s still a bear flag on the weekly tf and a retest of 65/66 is possible. Daily close below 68 would make me look for shorts for 100-200 ticks lower but that’s about it.
Invalidation is above 71.
short term: Neutral around 70. Bulls need a daily close above and bears something below 68 again.
medium-long term - Update from 2025-02-23: Bear trend is getting weaker but I still see this going sideways around 70 instead of a range expansion.
current swing trade: None
chart update: Removed last bear trend line, market is neutral at 70.

Crude Oil at Decision Point — Breakout Coming or Just More Chop?Crude is nearing the apex of a descending triangle, but the conflicting signals across timeframes make this a tough read. The daily is breaking out to the upside, while the 4H is pushing lower — classic mixed market structure. Are we about to fake out in both directions before rolling over to fresh lows, or is this a genuine attempt to break higher? Honestly, both long and short setups feel like low-probability plays right now. Sometimes, the best trade is no trade.

buyers coming into the marketprice hit a higher timeframe resistence area at the end of the week, which we see lots
of selling off & a bearish engulfing candle.
price has now hit an institutional candle & is showing sighns of rejection from that area
buyers have already started to enter the market , as we can see on a lower timeframe.
i will be looking for buys at market open,

Crude Oil (WTI) Bullish Breakout – Eyes on $78.47!🚀 Crude Oil (WTI) Bullish Breakout – Eyes on $78.47! 🚀
📊 Trade Setup:
Entry Price: $73.12
Take Profit 1: $73.99
Take Profit 2: $76.20
Take Profit 3: $78.47
Stop Loss: $71.21 (below key support zone)
📈 Analysis:
After months of trading in a range, WTI Crude Oil has broken above the upper boundary of the channel , signaling a bullish breakout. This breakout is supported by:
1️⃣ China's Economic Optimism: Growth pledges and potential stimulus are boosting demand expectations.
2️⃣ Technical Momentum: Key resistance at $71.50 and $74 has been breached, opening the path toward higher targets.
3️⃣ Tight Weekly Chart Range: A big move was anticipated, and the bulls delivered!
🎯 Targets:
With momentum on our side, we’re targeting:
$73.99: Quick resistance retest.
$76.20: Alignment with prior highs.
$78.47: Major resistance and breakout zone.
🔹 Risk Management:
Stop loss at $71.21, well below the key support zone, ensures controlled risk in case of reversal.
⚡ Are you riding the breakout, or watching from the sidelines? Let me know your thoughts below! ⚡

Bearish Analysis: Crude Oil (CL Futures)1️⃣ Rejected at Supply Zone:
The price was strongly rejected from the $80 supply zone, where sellers clearly took control. This zone has been a key resistance level, and the recent bearish momentum confirms strong selling pressure.
2️⃣ Bearish Momentum in Play:
The sharp decline from the supply zone has broken short-term supports, signaling sustained bearish movement. The next major target is the $66–$67 demand zone, where buyers may step in.
3️⃣ Technical Indicators Supporting Bears:
RSI: At 54.88, the RSI suggests there’s room for further downside before reaching oversold conditions.
Stochastic Oscillator: A bearish crossover between the %K and %D lines confirms increasing selling pressure, with momentum favoring a continuation of the trend.
4️⃣ Fundamentals Adding Pressure:
Trump’s Energy Policy: Potential policy changes to increase domestic oil supply could create a bearish outlook for crude oil.
Stronger Dollar: The strengthening USD makes oil more expensive for global buyers, further dampening demand and supporting the bearish case.
🎯 Strategy:
TP1: $75 (Near-term target, close to the current price).
TP2: $74.30 (Minor support, a potential bounce or pause area).
TP3: $72 (A strong psychological and technical level).
TP4: $67 (Major demand zone).
🔔 Note:
Consider using a positive stop loss to secure gains and reduce risk. Always practice proper risk management to protect your capital and maintain consistent results.

CRUDE - WEEKLY SUMMARY 24.3-28.3 / FORECAST🛢 CRUDE – 17th week of the base cycle (28 weeks), second phase. The extreme forecast on March 27 halted the second phase’s upward movement at the 70 resistance level and reversed the trend. This forecast was specifically highlighted for crude at the beginning of the year. A short position has been opened. The next universal extreme forecast is April 7. The next crude-specific extreme forecast is May 5.
