MCX Crude oil Weekly LevelsAs shown in the attached chart, now MCX Crude Oil having Support at 5780 & Resistance at 5920 (1 hour chart) and need to close a candle above or below the said level (hourly basis) for any major movement.
Disclaimer:- All the shared views are for educational purposes only. We provide Technical Indicators only for educational purposes. As we are not SEBI registered, there will be no claim rights reserved. Please consult your financial advisor before trading or investing.
TCS1! trade ideas

CRUDE - WEEKLY SUMMARY 10.3-14.3 / FORECAST🛢 CRUDE – 15th week of the base cycle (28 weeks). Timing and structure indicate signs of a double bottom and the start of the second phase.
⚠️ My bearish outlook remains unchanged, as outlined in my summer 2024 crude oil post. The next extreme forecast is March 19, coinciding with retrograde Mercury on March 17.

CRUDE OIl PROBABLY IN WAVE 'C' - SHORTCRUDE OIL is most probably in wave C of a bigger ABC wave, as C waves are impulse waves they should unfold as a 5 wave structure down.
If the wave count is correct then wave C will either equal wave A or you can use the triangle measure rule for targets if your a chart pattern person.
Direction is looking down, however Bears will have to fight thru the support range level 65 - 61 or base of the triangle level first. As wave C is an impulse wave price should move fast downwards once support level is breach.
Incase price starts holding around support level, it will indicate that prices will reverse upward for a more complex corrective wave structure.
Let see how this plays, Good Luck !
Disclaimer: The information presented in this wave analysis is intended solely for educational and informational purposes. It does not constitute financial or trading advice, nor should it be interpreted as a recommendation to buy or sell any securities.

U.S. Crude Imports Remain Weak While Exports DeclineShifting Trade Flows and Supply Balances
U.S. crude oil imports declined by 106,000 barrels per day (bpd) last week, bringing total inbound shipments to 5.8 million bpd. Over the past four weeks, imports have averaged 10.7% lower than the same period last year, reflecting a sustained trend of reduced reliance on foreign crude. This decline aligns with the broader market shift, as the U.S. continues to strengthen its position as a net exporter of petroleum products.
At the same time, crude exports fell by 52,000 bpd, indicating a temporary slowdown in outbound shipments. While the U.S. remains a major supplier to global markets, fluctuating trade volumes suggest ongoing adjustments in global crude flows, influenced by price differentials, refining demand, and geopolitical factors.
Market Impact and Price Trends
The reduction in both imports and exports comes amid a broader buildup in U.S. crude inventories, which increased by 3.6 million barrels last week. Despite this, WTI crude prices ( PYTH:WTI3! ) dipped below $70 per barrel, reinforcing concerns about softening demand. With domestic production stable and refinery runs declining, import volumes may remain subdued in the near term, potentially keeping a lid on crude price recoveries.
Global crude market participants are closely watching how U.S. trade patterns evolve, especially as OPEC+ production policies and refining activity shifts impact supply dynamics. If U.S. refiners ramp up utilization rates in the coming months, crude import demand could see a rebound, affecting both domestic stockpiles and global price balances.
Investment and Trading Considerations
For energy investors, the decline in imports highlights the growing influence of domestic production on U.S. supply stability. Companies focused on pipeline transportation and export infrastructure, such as Enterprise Products Partners ( NYSE:EPD ) and Kinder Morgan ( NYSE:KMI ), may see shifts in demand for their services depending on how trade volumes evolve. Additionally, crude tanker stocks could be impacted if global crude flows continue to adjust to changing U.S. trade balances.
The continued decline in U.S. crude imports signals a structural shift in supply dynamics, with domestic production playing an increasingly dominant role. However, reduced exports may indicate near-term softness in global demand, creating a complex backdrop for crude price movements in the weeks ahead.

Crude Oil - Symmetrical Triangle Breakdown Watch
Crude oil is testing the lower trendline of the symmetrical triangle on the 1-hour timeframe, showing increasing selling pressure.
🔹 Bearish Scenario:
A break below 5820 can trigger further downside, leading to targets around 5780 - 5750 - 5700.
🔹 Bullish Rebound:
If the support at 5860 holds, a bounce toward 5900 - 5930 is possible.
📊 Watch price action closely for confirmation before taking positions!
🔔 Like & Follow for more real-time market updates!

Overall downtrend but potential breakout is forming.Overall, the pitchfork indicates a downtrend in crude oil. However, a potential breakout is forming. If successful, we could see a price increase in the short term.

Possible Buy on Retracement for OilOil is in undecided territory right now on the verge of what looks like a macro shift, that said in the shorter term we can see a setup for a possible bullish move on the intraday. This is confluenced by the bullish 50 and 100 Moving Average Cross. My confidence in this trade is limited as, after all, it is Oil, but time will be the best teacher.

CL About To Move Up 1 Dollar!!!Based On My Trading Algorithms CL Is About To Move Up 1 Dollar!!! [/b

What Are Financial Derivatives and How to Trade Them?What Are Financial Derivatives and How to Trade Them?
Financial derivatives are powerful instruments used by traders to speculate on market movements or manage risk. From futures to CFDs, derivatives offer potential opportunities across global markets. This article examines “What is a derivative in finance?”, delving into the main types of derivatives, how they function, and key considerations for traders.
What Are Derivatives?
A financial derivative is a contract with its value tied to the performance of an underlying asset. These assets can include stocks, commodities, currencies, ETFs, or market indices. Instead of buying the asset itself, traders and investors use derivatives to speculate on price movements or manage financial risk.
Fundamentally, derivatives are contracts made between two parties. They allow one side to take advantage of changes in the asset's price, whether it rises or falls. For example, a futures contract locks in a price for buying or selling an asset on a specific date, while a contract for difference (CFD) helps traders speculate on the price of an asset without owning it.
The flexibility of derivatives is what makes them valuable. They can hedge against potential losses, potentially amplify returns through leverage, or provide access to otherwise difficult-to-trade markets. Derivatives are traded either on regulated exchanges or through over-the-counter (OTC) markets, each with distinct benefits and risks.
Leverage is a very common feature in derivative trading, enabling traders to control larger positions with less capital. However, it’s worth remembering that while this amplifies potential returns, it equally increases the risk of losses.
These instruments play a pivotal role in modern finance, offering tools to navigate market volatility or target specific investment goals. However, their complexity means they require careful understanding and strategic use to potentially avoid unintended risks.
Key Types of Financial Derivatives
There are various types of derivatives, each tailored to different trading strategies and financial needs. Understanding the main type of derivative can help traders navigate their unique features and applications. Below are the most common examples of derivatives:
Futures Contracts
Futures involve a contract to buy or sell an asset at a set price on a specific future date. These contracts are standardised and traded on exchanges, making them transparent and widely accessible. Futures are commonly used in commodities markets—like oil or wheat—but also extend to indices and currencies. Traders commonly utilise this type of derivative to potentially manage risks associated with price fluctuations or to speculate on potential market movements.
Forward Contracts
A forward contract is a financial agreement in which two parties commit to buying or selling an asset at a predetermined price on a specified future date. Unlike standardised futures contracts, forward contracts are customizable and traded privately, typically over-the-counter (OTC). These contracts are commonly used for hedging or speculating on price movements of assets such as commodities, currencies, or financial instruments.
Swaps
Swaps are customised contracts, typically traded over-the-counter (OTC). The most common types are interest rate swaps, where two parties agree to exchange streams of interest payments based on a specified notional amount over a set period, and currency swaps, which involve the exchange of principal and interest payments in different currencies. Swaps are primarily used by institutions to manage long-term exposure to interest rates or currency risks.
Contracts for Difference (CFDs)
CFDs allow traders to speculate on price changes of an underlying asset. They are flexible, covering a wide range of markets such as shares, commodities, and indices. CFDs are particularly attractive as they allow traders to speculate on rising and falling prices of an asset without owning it. Moreover, CFDs provide potential opportunities for short-term trading, which may be unavailable with other financial instruments.
Trading Derivatives: Mechanisms and Strategies
Trading derivatives revolves around two primary methods: exchange-traded and over-the-counter (OTC) markets. Each offers potential opportunities for traders, depending on their goals and risk tolerance.
Exchange-Traded Derivatives
These derivatives, like futures, are standardised and traded on regulated exchanges such as the Chicago Mercantile Exchange (CME). Standardisation ensures transparency, making it potentially easier for traders to open buy or sell positions. For example, a trader might use futures contracts to hedge against potential price movements in commodities or indices.
Over-the-Counter (OTC) Derivatives
OTC derivatives, including swaps and forwards and contracts for difference, are negotiated directly between two parties. These contracts are highly customisable but may carry more counterparty risk, as they aren't cleared through a central exchange. Institutions often use OTC derivatives for tailored solutions, such as managing interest rate fluctuations.
Strategies for Trading Derivatives
Traders typically employ derivatives for speculation or hedging. Speculation involves taking positions based on anticipated market movements, such as buying a CFD if prices are expected to rise. Hedging, on the other hand, can potentially mitigate losses in an existing portfolio by offsetting potential risks, like using currency swaps to protect against foreign exchange volatility.
Risk management plays a crucial role when trading derivatives. Understanding the underlying asset, monitoring market conditions, and using appropriate position sizes are vital to navigating their complexity.
CFD Trading
Contracts for Difference (CFDs) are among the most accessible derivative products for retail traders. They allow for speculation on price movements across a wide range of markets, including stocks, commodities, currencies, and indices, without owning the underlying asset. This flexibility makes CFDs an appealing option for individuals looking to diversify their strategies and explore global markets.
How CFDs Work
CFDs represent an agreement between the trader and the broker to exchange the difference in an asset's price between the opening and closing of a trade. If the price moves in the trader’s favour, the broker pays the difference; if it moves against them, the trader covers the loss. This structure is straightforward, allowing retail traders to trade in both rising and falling markets.
Why Retail Traders Use CFDs
Retail traders often gravitate towards CFDs due to their accessibility and unique features. CFDs allow leverage trading. By depositing a smaller margin, traders can gain exposure to much larger positions, potentially amplifying returns. However, you should remember that this comes with heightened risk, as losses are also magnified.
Markets and Opportunities
CFDs offer exposure to an extensive range of markets, including stocks, forex pairs, commodities, and popular indices like the S&P 500. Retail traders particularly appreciate the ability to trade these markets with minimal upfront capital, as well as the availability of 24/5 trading for many instruments. CFDs also enable traders to access international markets they might otherwise find difficult to trade, such as Asian or European indices.
Traders can explore a variety of CFDs with FXOpen.
Considerations for CFD Trading
While CFDs offer potential opportunities, traders must approach them cautiously. Leverage and high market volatility can lead to significant losses. Effective risk management in derivatives, meaning using stop-loss orders or limiting position sizes, can help traders potentially navigate these risks. Additionally, costs like spreads, commissions, and overnight fees can add up, so understanding the total cost structure is crucial.
Key Considerations When Trading Derivatives
Trading derivatives requires careful analysis and a clear understanding of the associated risks and potential opportunities.
Understanding the Underlying Asset
The value of a derivative depends entirely on its underlying asset, whether it’s a stock, commodity, currency, or index. Analysing the asset’s price behaviour, market trends, and potential volatility is crucial to identifying potential opportunities and risks.
Choosing the Right Derivative Product
Different derivatives serve different purposes. Futures might suit traders looking for exposure to commodities or indices, while CFDs provide accessible and potential opportunities for those seeking short-term price movements. Matching the derivative to your strategy is vital.
Managing Risk Effectively
Risk management plays a significant role in trading derivatives. Leverage can amplify both returns and losses, so traders often set clear limits on position sizes and overall exposure. Stop-loss orders and diversification are common ways to potentially reduce the impact of adverse market moves.
Understanding Costs
Trading derivatives involves costs like spreads, commissions, and potential overnight financing fees. These can eat into potential returns, especially for high-frequency or leveraged trades. A clear understanding of these expenses may help traders evaluate the effectiveness of their strategies.
Monitoring Market Conditions
Derivatives are sensitive to their underlying market changes, from geopolitical events to macroeconomic data. In stock derivatives, this might be company earning reports or sudden shifts in management. Staying informed helps traders adapt to shifting conditions and avoid being caught off guard by sudden price swings.
The Bottom Line
Financial derivatives are versatile tools for trading and hedging, offering potential opportunities to access global markets and diversify strategies. While their complexity demands a solid understanding, they can unlock significant potential for informed traders. Ready to explore derivatives trading? Open an FXOpen account today to trade CFDs on more than 700 assets with competitive costs, fast execution, and advanced trading tools. Good luck!
FAQ
What Is a Derivative?
The derivatives definition refers to a financial contract whose value is based on the performance of an underlying asset, such as stocks, commodities, currencies, or indices. Derivatives are financial instruments used to hedge risk, speculate on price movements, or access specific markets. Examples include futures, forwards, swaps, and contracts for difference (CFDs).
What Are the 4 Main Derivatives?
The primary categories of derivatives are futures, forwards, swaps, and contracts for difference (CFDs). Futures are commonly traded on exchanges, while forwards, swaps and CFDs are usually traded over-the-counter (OTC). Each serves different purposes, from risk management to speculative trading.
What Is the Derivatives Market?
The derivatives market is where financial derivatives are bought and sold. It includes regulated exchanges, like the Chicago Mercantile Exchange, and OTC markets where customised contracts are negotiated directly between parties. This market supports hedging, speculation, and risk transfer across global financial systems.
What Is the Difference Between Derivatives and Equities?
Equities signify ownership in a company, typically in the form of stock shares. Derivatives, on the other hand, are contracts that derive their value from the performance of an underlying asset, which can include equities. Unlike equities, derivatives do not confer ownership.
Is an ETF a Derivative?
No, an exchange-traded fund (ETF) is not a derivative. It is a fund that tracks a basket of assets, such as stocks or bonds, and trades like a stock. However, ETFs can use derivatives, such as futures, to achieve their investment objectives.
Is the S&P 500 a Derivative?
No, the S&P 500 is not a derivative. It is a stock market index that tracks the performance of 500 large companies listed in the US. Derivatives, like futures, can be created based on the S&P 500’s performance.
This article represents the opinion of the Companies operating under the FXOpen brand only. It is not to be construed as an offer, solicitation, or recommendation with respect to products and services provided by the Companies operating under the FXOpen brand, nor is it to be considered financial advice.

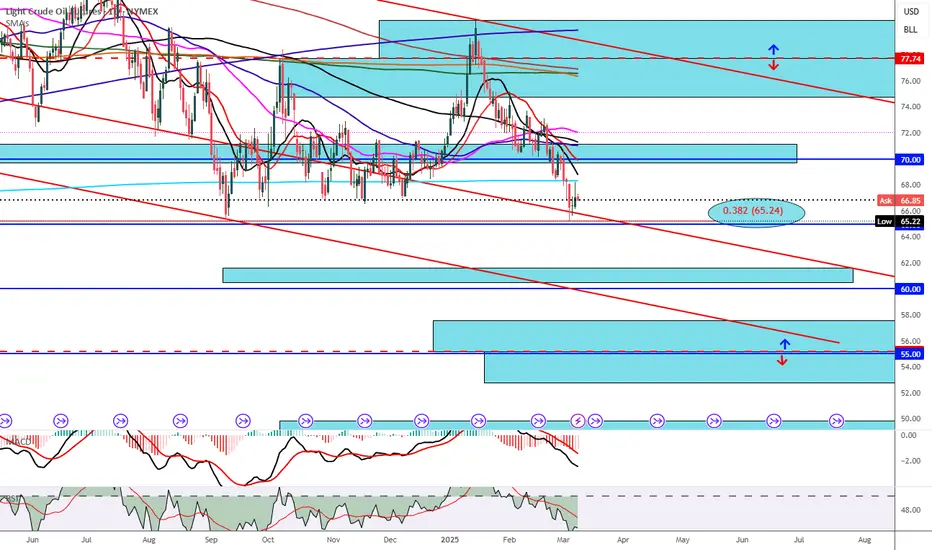
This is a more detailed 1-hour chart of WTI Crude Oil Futures
Current price appears to be trading around $66.40-$66.60, having recently bounced from a low point near $65.36 (marked with an orange line). The chart reveals several important technical elements:
1. The price is currently in a consolidation phase after a significant downtrend
2. There's a clear dotted red resistance line around $66.40-$66.60 that the price is currently testing
3. Multiple descending trendlines (red) show continued overall bearish pressure
4. Support at $65.36 was tested and held, creating a potential short-term bottom
For this evening's price movement, the most likely scenarios are:
1. Primary scenario: Rejection at the current resistance level around $66.40-$66.60 (dotted red line) with a retest of the $65.36 support level. The volume profile and overhead resistance suggest this is the path of least resistance.
2. Secondary scenario: If buyers can sustain momentum, a push toward the $66.80-$67.00 level is possible, which represents the next significant resistance zone.
The presence of multiple bearish trendlines and the recent downtrend suggests that upside moves may be limited, making the primary scenario of a move back toward $65.36 more probable for this evening's session.
The increased volume during the recent sell-off (visible in the volume bars at the bottom) further supports a bearish bias, though the bounce from $65.36 suggests some buying interest at that level.

.382- 65.24 Do or Dive CL1 daily - from neg - 40.32 to top 130.5 it's been testing .382 bull nicely 65.24 below is mid fib barn 55 to .5 / 45.09 - 1597 sma above could be played -should be an interesting wk - . Keep your stick on the ice . Boosts appreciated 😁
.382 -65.24 do or Dive CL1 3 day - from neg - 40.32 to top 130.5 it's been testing .382 bull nicely 65.24 the 1597 is down at 55 mid fib barn to .5 / 45.09 - should be an interesting wk - 233 sma green test atm . Keep your stick on the ice . Boosts appreciated 😁

.382 -65.24 do or dive CL1 weekly - from neg - 40.32 to top 130.5 it's been testing .382 bull nicely 65.24 the 1597 is down at 55 mid fib barn to .5 / 45.09 - should be an interesting wk - 233 sma green test atm . Keep your stick on the ice . Boosts appreciated 😁

CRUDE - WEEKLY SUMMARY 3.3-7.3 / FORECAST🛢 CRUDE – 14th week of the base cycle (28 weeks), a very mature Phase 1. The March 3 extreme forecast reversed a 2-day correction into a new bearish wave, pushing below the broken and eroded support level. This scenario was anticipated two weeks ago.
Price range from the March 3 extreme forecast to the current move: $2K per contract.
Based on timing (14 weeks) and chart structure, Phase 2 may have begun.
⚠️ Bearish outlook remains, as outlined in my summer 2024 crude oil post.
Next extreme forecast: March 19, aligning with retrograde Mercury on March 17.

CrudeOil Long for Upcoming WeeksCrudeoil Looking Bullish From CMP. Expect Slightly Sideways price movement from cmp. overall looking good to capture 1000 points in 1-2 months time horizon with Favoruable Risk. If Buyers Sustain price above cmp.

oil and the case for why you live in a movieYou ever wonder why the last two elections of the beloved man went kinda similar.
Like two women, and they were hated by all, but "pumped" by the media...
Then 2-3.5 weeks out from the election, SNL makes fun of the women and they are said to be "not what Americans need or want" or something to that tune
Then suddenly there is mass "oh deep state suddenly exists now" within 3 weeks of the elections lasting into the first 2 months of office holding.
Then there is this whole sudden complacency among everyone by like month 1.5 to 2 months in...even though the country is being torn to shreds infrastructure wise and debt laden to the teeth
Then there is the mass promises to fight off the baddies and expose everyone for their wrong doing and get "Merika" back on track
Then there is this sudden shakeup where people start wondering why their guy is offloading tariffs and sanctions on everyone and yet not focusing on this whole infrastructure "make this pig pretty again" and then pumping Ukraine with money and weapons>>>"I sent the Javelins"
Then we shall skip that 2020 stuff for reasons that if it wasn't there, you couldn't see it (check out a simple googling of "excess deaths constant across decades" to see if you can't see IT)
Then he gets labeled a baddie and needs to be run out of town with supposed election complications allowing for 4 years of >>>>look that way>>now look at NVDA>>>now look at Ukraine>>>then dont look there>>>now look at those terrible people making everything for us cheaply and not supplying weapons to a place as close as Cuba>>>now look at USAID>>okay every whats that in the sky...is that Dodge or some shiny coin...wait no, just more rug pulls by sanctioned and elected people
are you catching my drift....you need to see that the roads are bad, your insurance premiums are high and medical attention is poor...and that the "American dream is basically up for grabs", so you all just handed it to someone who literally rug pulled all of you 2 times before and after inauguration and then once again last Sunday on a media post
Here...this is from some of the guys at the 4 "Three Letter Agencies" i worked with and had contacts with to make sure you can think properly... a thought experiment:
If it looks like a duck, okay....And it walks like a duck, okay....and it quacks like a duck, okay...Then how did inferior steel and technology that is less significant that a Nvidia GPU get to the marble in the sky and we haven't done it since that great sexy year :), okay...its because You are the duck and you live off the crumbs you are fed. To which when you complain, the feeders (powers at be/deep state) say, "You were free to do as you please and leave at any time and you decided to come over for something real quick to satisfy you and forgot who you were....look in the pond and what do you see?"
ask any childhood torture victim or study abused people^^^ its how you know, cause if you dont get it, then you never will.
So in short....Chinese electric use is skyrocketing and their oil is going down due to technological achievements and there is less going on in the west cause you have been in a recession since 2022...look at many charts of staple food or product companies and you will see it. So hold on folks...cause that next piece of bread they are planning to throw out at you may be a dooosy
ps..spelling of words and phrases structured in a way are made so to elicit certain feelings...so read carefully and remember: "Fire" can be said 5 different ways but its just a word after all

Crude OIL(INR) Analysis - ShortI have analyzed Crude with price action, trend & Gann system with angles. Stop loss will 20 point up. And target is apple.
I am also available on X as "skumarinsweden"

Recap: Short below LIS/Yearly Open Crude OilNYMEX:CL1!
Another day and EdgeClear brings you another recap where one of the highlighted scenarios in our weekly plan for WTI crude oil, published on February 24, 2025 , played out as expected.
Our Scenario 3 looked at price discovery extending the 2025 range into Q4 2024 lower distribution. Our analysis indicated an initial move lower bouncing from CVPOC 2022 support. The key was price moving below key LIS/yearly open. We did not see a bearish head and shoulders pattern develop, however, the rest of the plan played out as expected.
Note the price action till Friday, 28th Feb 2025.
We have been consistently providing traders with a roadmap for WTI crude oil with our thoughts and opinions on the market. WTI crude oil is a fundamental product that is affected by several factors, such as: macro, geopolitical, economic, supply, demand, and oil production dynamics.
Our analysis considers these developments along with auction market theory and key indicators that may be important to watch at times. As an example, for our January 13, 2025, blog , we noted increased volume with increased open interest that drove bullish sentiment in crude oil prices. We also highlighted potential short opportunities that played out per our plan.
For last week’s blog, we noted the overall trend in volume and open interest falling, indicating a potential move lower. This combined with multiple tests of our key LIS/ yearly open, strengthened our thesis for further price discovery lower.
In our blog, we have highlighted two key ranges:
$70 - $75 - Q1 2025 Value Area
$65 - $70 - Q4 2024 Lower Distribution
Focus is shifting towards oil market fundamentals i.e., supply, demand, and production outlook.
While headline news may drive short-term and intraday volatility, investors and market participant’s focus will shift towards oil market fundamentals. On March 3rd, 2025, OPEC+ reaffirmed its decision from December 5, 2024, to proceed with gradual and flexible return of 2.2 mbpd voluntary cuts, starting April 1, 2025. It provided a detailed table along with a cautious approach should this decision require any amendments. In our analysis, while trade war and tariff tantrum create uncertainty around demand outlook, any news providing clarity on tariffs will be considered net positive.

Crude Oil ShortDaily downtrend
4H downtrend
supply zone in line with fibbo 61.8
great risk reward ratio

#SPY How to trade this downtrend? Analysis of the market. Did we change our trend? How you should plan downtrends, change of trends and possible good low entrys on good names. Wealth creation trading... Insights of a technical trader

Oil broke important support trendlineOil broke an import support trendline yesterday at tariff confirmations.
Weak energy demands typically means a recession is near.

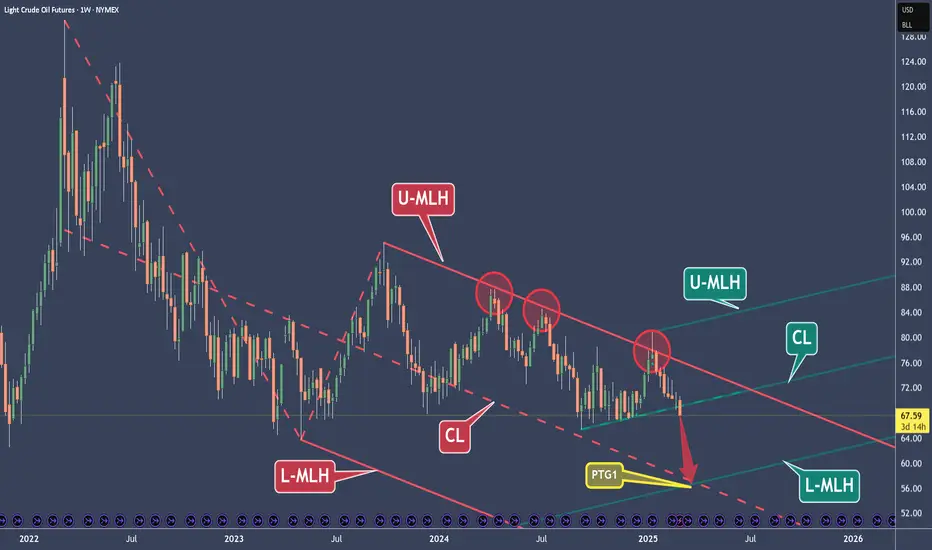
Crude Oil – A $10 Short with a Valuable LessonThe price hit the Upper Median Line Handle (U-MLH) three times and was rejected each time (red circles). These were all high-potential short trade opportunities.
However, none of these short trades managed to reach the Profit Target Goal (PTG) at the Center Line (CL). When the price repeatedly fails to hit the CL, it often builds up momentum for a larger move.
The last short opportunity from the U-MLH was at Circle #3. If you missed it, you have another chance now. Breaking the "shelf" (the petrol support line) is just like breaking a Median Line or a Center Line. It’s not magic—though it may sometimes seem like it.
The three slanted petrol lines extending to the right function the same way as a fork. So, we just broke the (petrol) Center Line, right?
Now, where is the price likely to go after breaking this (petrol) Center Line?
That’s right! There is about an 80% probability that it will move towards the (petrol) Lower Median Line Parallel.
What a coincidence—it aligns exactly with the red Center Line!
Of course, this is all based on probabilities, not guarantees. We can't predict the future, but we can rely on rules, statistics, and knowledge.
I hope you learned something today.
If you enjoy my work, I’d appreciate it if you like and share it with others.
Have a great day! 😊
Bitcoin crude oil3.3.25 Bitcoin had an incredible move lower and then quickly came back into the original range box... the take-home message on bitcoin is that it's trading in a Range and while it is not at the new high there's a reasonable chance that this Market will go higher from here. more has to happen before I would be bearish on bitcoin. I started talking about crude oil and I didn't finish... I would not be a buyer or a seller on crude and I'll clarify it on another video. I will also talk about gold and silver. I spent most of the time showing you pattern setups and reversal patterns and ABCD patterns and range boxes and that you trade range boxes to double if they go higher or they double and go lower and when you use that relationship the market typically takes you to the next level. I use a handful of tools and then I make my decisions and it's always about where the buyers and sellers are and something that I call to bar reversals. I always look at markets to decide if they are expanding or Contracting because those properties if you follow them will help you decide how far the market will move in your favor if you're long or short and they allow for you to have small stops and if you use the techniques you'll know what a realistic Target is as a buyer or a seller.. be patient with my style of delivery eventually you'll see the patterns and will decide if this is the way you want to trade but like any system you should get used to drawing the patterns and always be cognizant of whether a markets trending or ranging or is expanding or Contracting.
