NATGAS WILL FALL|SHORT|
✅NATGAS made a retest of the
Strong horizontal resistance level of 3.150$
And as you can see the price is already
Making a local pullback from
The level which sends a clear
Bearish signal to us therefore
We will be expecting a
Further bearish correction
SHORT🔥
✅Like and subscribe to never miss
Related commodities

NG1!: Strong Bullish Sentiment! Long!
My dear friends,
Today we will analyse NG1!together☺️
The price is near a wide key level
and the pair is approaching a significant decision level of 3.016 Therefore, a strong bullish reaction here could determine the next move up.We will watch for a confirmation candle, and then target the n
Natural Gas Slips Below Support – More Downside Ahead ?
Recent candles are large-bodied bearish candles, indicating strong selling pressure.
Bollinger Basis is sloping downward, showing short-term bearish momentum.
Price is currently below both the 20-day and 50-day moving averages, reinforcing the bearish outlook.

NATURALGAS TRENDLINE BREAKOUT OR FAKEOUT?Timeframe: 1H Breakout Watch 🚀
Technical Overview:
Natural Gas is testing key horizontal resistance around 272 after multiple rejections. Price is holding above 25 EMA and 55 EMA, showing short-term bullish momentum.
Key Levels to Watch:
• Resistance: 272 – 274
• Breakout Target: 278 – 280 (if s

NG FUT long setupNG FUT long setup
Entry - 260.8
Stop loss - 260
Target - 267.4
Risk Reward - 1:11.3

Gold | Oil | Dollar | Silver | Natural Gas Price ForecastGold | Oil | Dollar | Silver | Natural Gas Price Forecast
NYMEX:NG1! NYMEX:CL1! COMEX:GC1! COMEX:SI1!

U.S. Natural Gas Poised for Rebound After Steep July DropU.S. natural gas prices sank in July due to mild weather, strong supply, and LNG export disruptions. The EIA cut its price outlook but expects a recovery by winter.
While technicals hint at a short-term rebound, oversupply and weak summer demand keep pressure on prices. A sustained recovery depends

NATGAS The Target Is UP! BUY!
My dear friends,
Please, find my technical outlook for NATGAS below:
The price is coiling around a solid key level - 2.996
Bias - Bullish
Technical Indicators: Pivot Points Low anticipates a potential price reversal.
Super trend shows a clear buy, giving a perfect indicators' convergence.
Goal
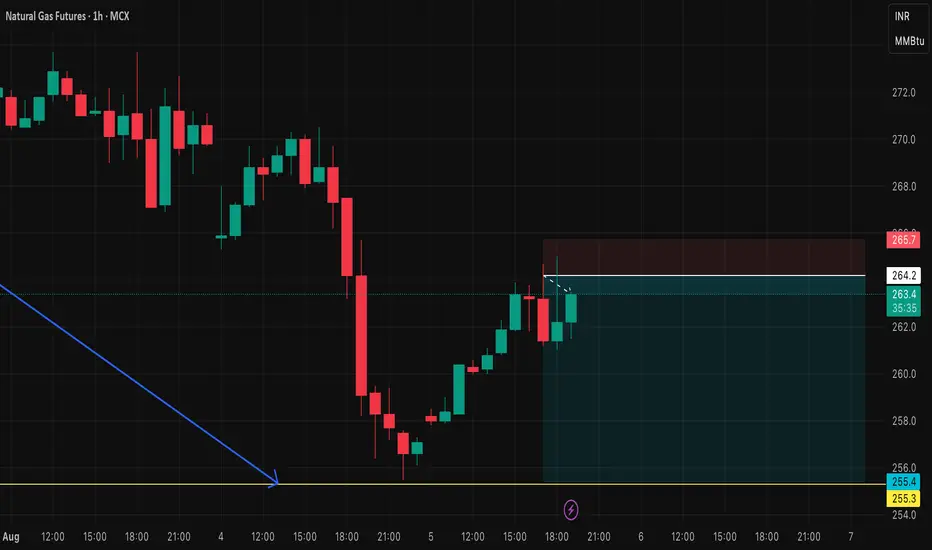
NF FUT short setupNG FUT short setup
Entry price - 264.2
Stop loss - 265.7
Target - 255.5
Risk Reward - 1:5.6
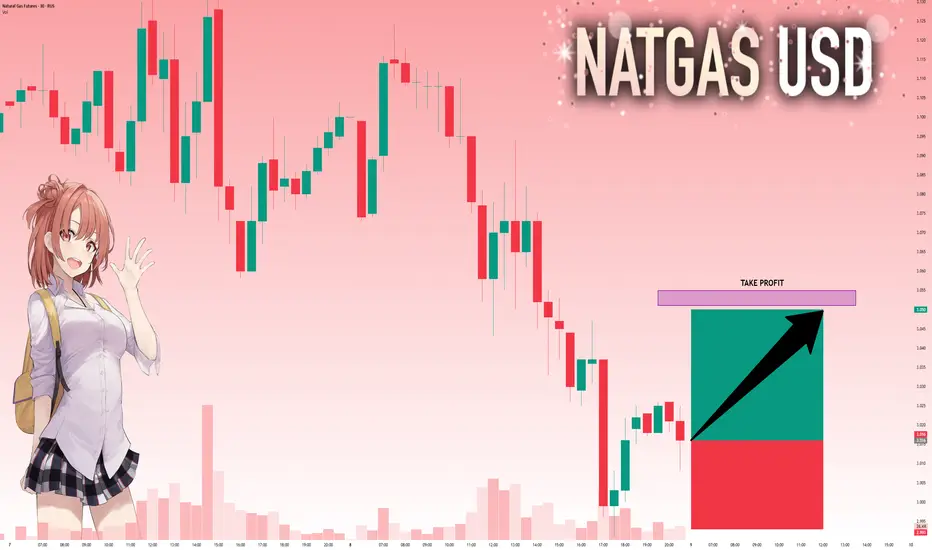
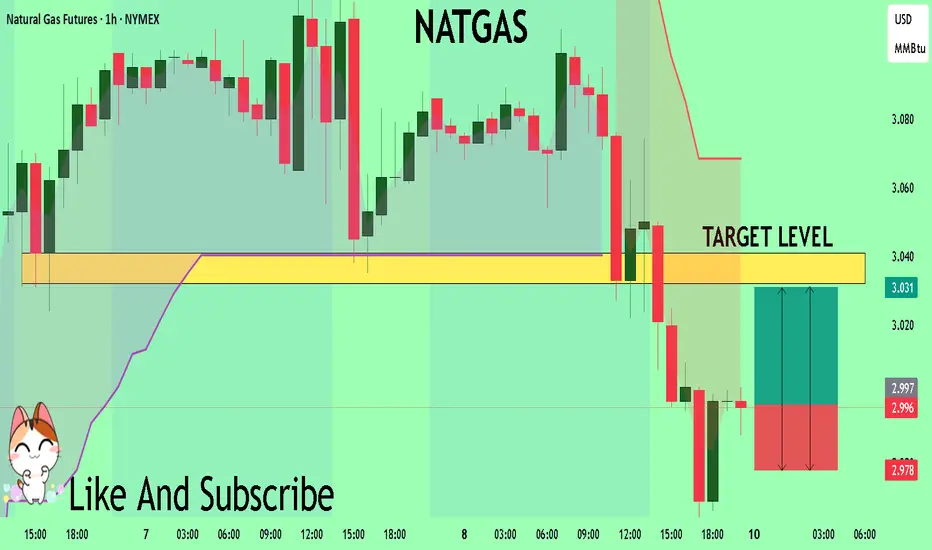
NG1! BUYERS WILL DOMINATE THE MARKET|LONG
NG1! SIGNAL
Trade Direction: long
Entry Level: 2.996
Target Level: 3.043
Stop Loss: 2.964
RISK PROFILE
Risk level: medium
Suggested risk: 1%
Timeframe: 1h
Disclosure: I am part of Trade Nation's Influencer program and receive a monthly fee for using their TradingView charts in my analysis.
✅LI

See all ideas
Summarizing what the indicators are suggesting.
Neutral
SellBuy
Strong sellStrong buy
Strong sellSellNeutralBuyStrong buy
Neutral
SellBuy
Strong sellStrong buy
Strong sellSellNeutralBuyStrong buy
Neutral
SellBuy
Strong sellStrong buy
Strong sellSellNeutralBuyStrong buy
A representation of what an asset is worth today and what the market thinks it will be worth in the future.
Displays a symbol's price movements over previous years to identify recurring trends.
Frequently Asked Questions
The current price of Henry Hub TTF (ICIS Heren) Natural Gas Spread Futures (Nov 2025) is −8.279 USD — it has fallen −2.08% in the past 24 hours. Watch Henry Hub TTF (ICIS Heren) Natural Gas Spread Futures (Nov 2025) price in more detail on the chart.
Track more important stats on the Henry Hub TTF (ICIS Heren) Natural Gas Spread Futures (Nov 2025) chart.
The nearest expiration date for Henry Hub TTF (ICIS Heren) Natural Gas Spread Futures (Nov 2025) is Oct 31, 2025.
Traders prefer to sell futures contracts when they've already made money on the investment, but still have plenty of time left before the expiration date. Thus, many consider it a good option to sell Henry Hub TTF (ICIS Heren) Natural Gas Spread Futures (Nov 2025) before Oct 31, 2025.
Open interest is the number of contracts held by traders in active positions — they're not closed or expired. For Henry Hub TTF (ICIS Heren) Natural Gas Spread Futures (Nov 2025) this number is 0.00. You can use it to track a prevailing market trend and adjust your own strategy: declining open interest for Henry Hub TTF (ICIS Heren) Natural Gas Spread Futures (Nov 2025) shows that traders are closing their positions, which means a weakening trend.
Buying or selling futures contracts depends on many factors: season, underlying commodity, your own trading strategy. So mostly it's up to you, but if you look for some certain calculations to take into account, you can study technical analysis for Henry Hub TTF (ICIS Heren) Natural Gas Spread Futures (Nov 2025). Today its technical rating is buy, but remember that market conditions change all the time, so it's always crucial to do your own research. See more of Henry Hub TTF (ICIS Heren) Natural Gas Spread Futures (Nov 2025) technicals for a more comprehensive analysis.