Weekly Market Forecast: BUY Stock Indices & Oil! Sell Gold! In this Weekly Market Forecast, we will analyze the S&P 500, NASDAQ, DOW JONES, Gold and Silver futures, for the week of June 9 - 13th.
Stock Indices are looking more bullish. Valid buys only!
Gold is weak. Sells only until there is a market structure shift upwards.
Oil prices have room to go higher. Buy it.
Silver is a wait and see. Should start to pull back this week, as it closed last week stronger than Gold.
CPI Wednesday. After the news is announced, the market should be very tradeable for the rest of the week.
Enjoy!
May profits be upon you.
Leave any questions or comments in the comment section.
I appreciate any feedback from my viewers!
Like and/or subscribe if you want more accurate analysis.
Thank you so much!
Disclaimer:
I do not provide personal investment advice and I am not a qualified licensed investment advisor.
All information found here, including any ideas, opinions, views, predictions, forecasts, commentaries, suggestions, expressed or implied herein, are for informational, entertainment or educational purposes only and should not be construed as personal investment advice. While the information provided is believed to be accurate, it may include errors or inaccuracies.
I will not and cannot be held liable for any actions you take as a result of anything you read here.
Conduct your own due diligence, or consult a licensed financial advisor or broker before making any and all investment decisions. Any investments, trades, speculations, or decisions made on the basis of any information found on this channel, expressed or implied herein, are committed at your own risk, financial or otherwise.
WTI1! trade ideas

#202523 - priceactiontds - weekly update - wti crude oilGood Day and I hope you are well.
comment: Time to be very cautious as a bear and hopeful as a bull. 3 clear legs down and the third could not make a new low. Now the market closed at the weekly high and it’s a fitting place for a reversal. 65 should be the highest bears should allow it. If bulls get follow-through beyond, this is a buy with stop 59.5. The target above 65 is obviously 70 and maybe even the bigger bear trend line around 73.
current market cycle: monthly time frame is a broad bear channel - weekly tf is a bear wedge - daily is a trading range
key levels: 59 - 65
bull case: Bulls got their first daily close above the weekly20 ema since February. Bears tried to get the market below 60 but failed to keep it below - 3 times now since April. Markets will try one thing only so much until they try something else. 65 is the next target which will likely get hit early next week but I expect a bit more sideways until one side clearly gives up. Technically this is a double bottom April/May lows and now a higher low and bulls want to get the major trend reversal.
Invalidation is below 65.5
bear case: Bears are hopeful that the bear wedge is still enough resistance that we test down to 60 but they need a strong reversal below 65 to make it happen and when a weekly bar closes at the very high, it’s probably not a good time to be a bear. Best bears can hope for here is to stay below 65 and continue inside the current range 60-65.
Invalidation is above 65.5
short term: Bullish. I think a bull breakout is much more likely than hitting 60 again. Buying 64.58 with a stop 59.5 is likely a decent trade already. Confirmation for the breakout is 65.5ish.
medium-long term - Update from 2025-06-08: Market finds no acceptance below 60 since 2021 and now we have 3 clear legs down, a higher low and a breakout above prior high with a weekly close at the highs and the weekly 20ema. This is likely as good of a swing long as you can get.

Crude. Daily Internal to External Range Liquidity. 06.06.25Covering the crude expansion from daily internal towards the first external range liquidity

Crude oil-----Sell near 64.00, target 63.00-62.00Crude oil market analysis:
Crude oil is still bearish, and we will continue to sell on rebounds. If it does not break 65.00, it will fluctuate. The general trend is bearish. If it breaks, we will adjust our thinking. Today's crude oil is the key. Will it start to take off before the data? The previous crude oil inventory data did not allow crude oil to break the position. The crude oil fluctuation range is 60.00-65.00. If it breaks this range, we will adjust our thinking on fluctuations.
Operational suggestions
Crude oil-----Sell near 64.00, target 63.00-62.00

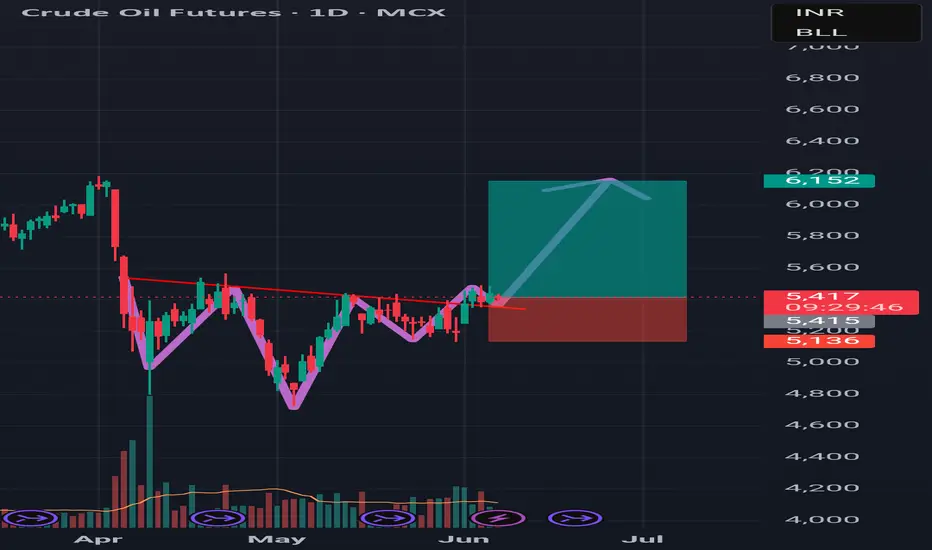
Long On CrudeI hold a strong conviction that in July Oil prices may soar above current trading levels

REVERSE HEAD AND SHOULDER PATTERNSCrude oil looks good can go long with Stoploss. Bigbreakout expected
WTI(20250606)Today's AnalysisMarket news:
The European Central Bank cut three key interest rates by 25 basis points. Lagarde hinted that the rate cut cycle will end, and the market is no longer fully pricing in another 25 basis point rate cut this year.
Technical analysis:
Today's buying and selling boundaries:
62.58
Support and resistance levels:
63.97
63.45
63.12
62.05
61.71
61.19
Trading strategy:
If the price breaks through 63.12, consider buying, and the first target price is 63.45
If the price breaks through 62.58, consider selling, and the first target price is 62.05

CL SELLSELL CL at 71.0000 or 68.000, riding it down to 55.5000 to 51.0000 as Profit Targets, Stop Loss is at 73.0000!
Warning: This is only for entertainment and opinion purpose. Trading is a risky business, so do your own due diligence, and trade at your own risk. You can loose all of your money and much more.

Short Crude Oil for The LeapRisk free trade for $100 on MCL
Scaling out of the trade from 4 hour supply to 4 hour demand.
Using the TrendCloud Trading System and it's working great.
So far I'm in the top 7% for this competition.
Focusing on managing this crude oil trade and also the opening range on the MNQ and NQ
Huge win on day 1 for $4000 on NQ opening range using the TrendCloud Trading Strategy.
Backtesting data shows great results. Super proud of this. It took me a month to program everything properly and optimize specifically for the NQ.

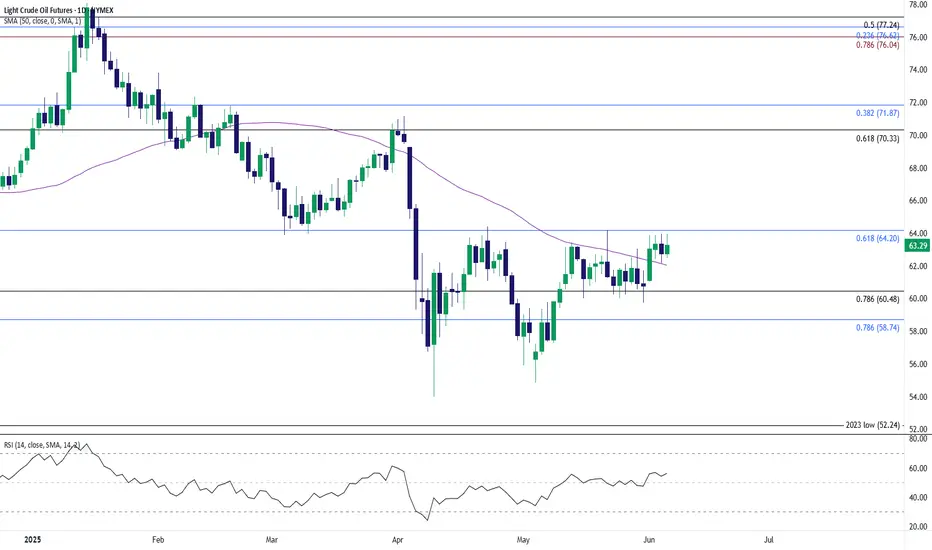
Oil Price on Cusp of Testing May HighThe price of oil is on the cusp of testing the May high ($64.19) after closing above the 50-Day SMA ($62.04) for the first time since April, with a break/close above $64.20 (61.8% Fibonacci retracement) bringing the April high ($71.16) on the radar.
Need a move/close above the $70.30 (61.8% Fibonacci retracement) to $71.90 (38.2% Fibonacci retracement) zone to open up the February high ($73.84), but lack of momentum to push/close above $64.20 (61.8% Fibonacci retracement) may keep the price of oil within the April range.
Failure to defend the advance from the weekly low ($61.06) may push crude back toward the $58.70 (78.6% Fibonacci extension) to $60.50 (78.6% Fibonacci retracement) region, with the next area of interest coming in around the May low ($54.84).
--- Written by David Song, Senior Strategist at FOREX.com
Coffee is going higher.6 5 25 coffee is going ... it just did a two-bar reversal. Tesla is moving lower and was a good short trade.... It traded down to a support area which was also a 382 retracement. it's possible for Tesla to find some buyers but it's more likely that it will continue our to the 618 retracement pattern that's on the chart. my videos have not been uploading and I'm not quite sure why so this is a test but there is a video.

Crude oil----sell near 64.00, target 63.00-60.00Crude oil market analysis:
Yesterday's crude oil still failed to rise. The buying price still failed to stand above 65.00 and was still fluctuating. Today, we continue to look at the range wave. We still consider selling it when it is close to 64. The crude oil inventory data does not give us much room for imagination. In addition, the recent fundamentals of crude oil are not strong, and they do not support the long position of crude oil, which has caused crude oil to fluctuate and hover. The current fluctuation range we see is 65.00-60.00.
Operation suggestions:
Crude oil----sell near 64.00, target 63.00-60.00

Liquidity Hunt: Crude Oil's Next TargetFenzoFx—Crude Oil remains below the $64.19 resistance level. The Stochastic Oscillator is in overbought territory, and RSI 14 signals bearish divergence, suggesting a possible price dip.
Oil could briefly surpass $64.19 to grab liquidity before facing selling pressure. In this case, a drop toward the $61.72 support level may occur to fill the bullish fair value gap.
However, if Oil stabilizes above $64.19, the bearish outlook becomes invalid.
>>> Trade Crude Oil without swap and low spread at FenzoFx

Crude oil futures Trade the range In this video I look at the current range that we are in and I have laid out a plan in the scenario that we break that range to the upside and what we could possibly expect .
I have given some reaction zones where I anticipate price to react when we reach there .
I have used Fibonacci, volume profile, and vwap in this video .
Thankyou for your support


#202522 - priceactiontds - weekly update - wti crude oil futuresGood Day and I hope you are well.
comment: 3 weeks inside a tight range but market keeps getting rejected under the weekly 20ema and it’s consecutive bear bars now. Below 59.8 I favor the bears for more downside.
current market cycle: monthly time frame is a broad bear channel - weekly tf is a bear wedge - daily is a trading range
key levels: 55 - 64
bull case: Bulls need a daily close above 64 to retest the bear trend line of this big bear wedge from the January high 78.1. That’s the whole story for now. Market oscillates around 61 without any momentum, so buy low, sell high until it stops working.
Invalidation is below 59.8.
bear case: Bears need a daily close below 59.8 for more downside but market has been pretty much in balance for 3 weeks around 61. Problem for the bulls is, that we closed lower again and the tails above the weekly bars are much bigger than the ones below bars. So bears are slightly favored but only very slightly.
Invalidation is above 64.4
short term: Neutral. Playing the range until it stops working but mostly only small scalps. Market is likely waiting for an end to the tariff madness which might not come.
medium-long term - Update from 2025-05-25: Need a clear break of the trading range 54 - 64 before we can come up with new targets. Bear trend (wedge) is valid until the trend line breaks.

Oil Bears May Look to PounceCrude oil futures have teetered for weeks, and the bears may be getting ready to pounce.
The first pattern on today’s chart is the sharp drop in early April after President Trump announced higher-than-expected tariffs. CL1! quickly broke the 65.27 level where it bounced in September and early March. Prices have stayed there since, which may reflect a lack of buying interest.
Second is the recent consolidation zone above the May 8 high of 60.29. Could a close below that level trigger selling?
Third, prices have remained consistently below their 50-day simple moving average since early February. That may suggest the intermediate-term trend is bearish.
Finally, the 8-day exponential moving average (EMA) recently crossed below the 21-day EMA. That may suggest the short-term trend is getting bearish.
These patterns could be important to watch heading into this weekend’s OPEC+ meeting.
Check out TradingView's The Leap competition sponsored by TradeStation.
TradeStation has, for decades, advanced the trading industry, providing access to stocks, options and futures. If you're born to trade, we could be for you. See our Overview for more.
Past performance, whether actual or indicated by historical tests of strategies, is no guarantee of future performance or success. There is a possibility that you may sustain a loss equal to or greater than your entire investment regardless of which asset class you trade (equities, options or futures); therefore, you should not invest or risk money that you cannot afford to lose. Online trading is not suitable for all investors. View the document titled Characteristics and Risks of Standardized Options at www.TradeStation.com . Before trading any asset class, customers must read the relevant risk disclosure statements on www.TradeStation.com . System access and trade placement and execution may be delayed or fail due to market volatility and volume, quote delays, system and software errors, Internet traffic, outages and other factors.
Securities and futures trading is offered to self-directed customers by TradeStation Securities, Inc., a broker-dealer registered with the Securities and Exchange Commission and a futures commission merchant licensed with the Commodity Futures Trading Commission). TradeStation Securities is a member of the Financial Industry Regulatory Authority, the National Futures Association, and a number of exchanges.
TradeStation Securities, Inc. and TradeStation Technologies, Inc. are each wholly owned subsidiaries of TradeStation Group, Inc., both operating, and providing products and services, under the TradeStation brand and trademark. When applying for, or purchasing, accounts, subscriptions, products and services, it is important that you know which company you will be dealing with. Visit www.TradeStation.com for further important information explaining what this means.

CL Trade Idea – Waiting for Buy Reaction in Demand Zonem currently watching Crude Oil Futures (CL) closely.
Price has broken below my EMA and is heading toward the demand zone marked in green . I’m not rushing in — waiting patiently for price to reach that zone and give me a reaction.
📌 What I'm Looking For:
A clear bullish reaction within the zone.
Volume confirmation showing buyer intent.
Order flow alignment (buyers stepping in, absorption, or reversal signs on the tape).
If all three line up, I’ll look for a long entry from that area targeting previous resistance levels.
Let’s see if buyers show up at the right spot. No confirmation = no trade.

Crude Oil is in Buy Side Discount LevelFenzoFx—Crude Oil formed a hammer candlestick pattern near weekly support after losing 4.0% of its value on Thursday. The London session began with a bullish FVG in the lower time frame, with support at $60.55.
The price is expected to target the immediate resistance at $61.3.

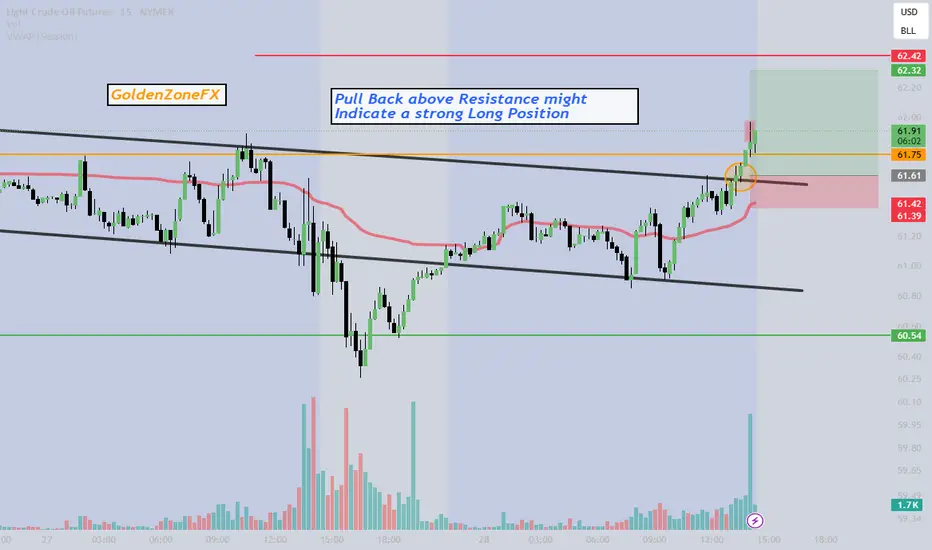
CL1 Breakout & Pullback Above Resistance – Strong Buy Signal ?The price has broken above the $61.75 resistance and successfully pulled back to retest it as support, confirming a strong buy opportunity.
Key Confirmations:
Breakout above resistance: Signals bullish strength.
Pullback retest: Former resistance now acting as support.
Volume surge: High buying interest reinforces the move.
VWAP positioning: Trading well above VWAP ($61.36), favoring bulls.
Profit Zone: Green-marked target area for potential upside.
Stop-Loss Consideration: Manage risk with a stop in the red-marked zone.
Trade Idea: If momentum holds, this setup could lead to a continued uptrend. Watch price action near support to confirm further movement.
Follow @GoldenZoneFX for more content and valuable insights!
What do you think? Let’s discuss this setup!
CL Analysis – May 28, 2025Currently, I believe Crude Oil (CL) is trading within a well-defined range. My strategy is clear:
🔴 Sell only at the red supply zone above, but only after confirmed seller reactions backed by order flow.
🟢 Buy only at the green demand zone below, once buyer strength is confirmed through price action and order flow.
No trades in between — I’m staying patient and letting the market come to my levels.

crude bulloversold sold rsi on the bottom of a strong wedge... strong support on the lows. looking to long crude

The Holy Trinity Gold Btc Up
Oi Down
Smells like OiL and Gold is under the custody of KREMLiN
playing GOD
GOLd drops oil should skyrocket
and BTC just follow a week or so later
