NG1!: Move Up Expected! Long!
My dear friends,
Today we will analyse NG1! together☺️
The price is near a wide key level
and the pair is approaching a significant decision level of 3.403 Therefore, a strong bullish reaction here could determine the next move up.We will watch for a confirmation candle, and then target the next key level of 3.429.Recommend Stop-loss is beyond the current level.
❤️Sending you lots of Love and Hugs❤️
QG1! trade ideas

NATGAS My Opinion! BUY!
My dear followers,
This is my opinion on the NATGASnext move:
The asset is approaching an important pivot point 3.387
Bias - Bullish
Safe Stop Loss - 3.269
Technical Indicators: Supper Trend generates a clear long signal while Pivot Point HL is currently determining the overall Bullish trend of the market.
Goal - 3.630
About Used Indicators:
For more efficient signals, super-trend is used in combination with other indicators like Pivot Points.
Disclosure: I am part of Trade Nation's Influencer program and receive a monthly fee for using their TradingView charts in my analysis.
———————————
WISH YOU ALL LUCK


Nat Gas; Dip then RipA slight breather as expected for NG prices after such a strong reversal, from the storage report lows on 6/27/2025. Support for NG based on volume looks to be in the $3.55 to $3.65 range, before continuing a move up to $4+. NYMEX:NG1!

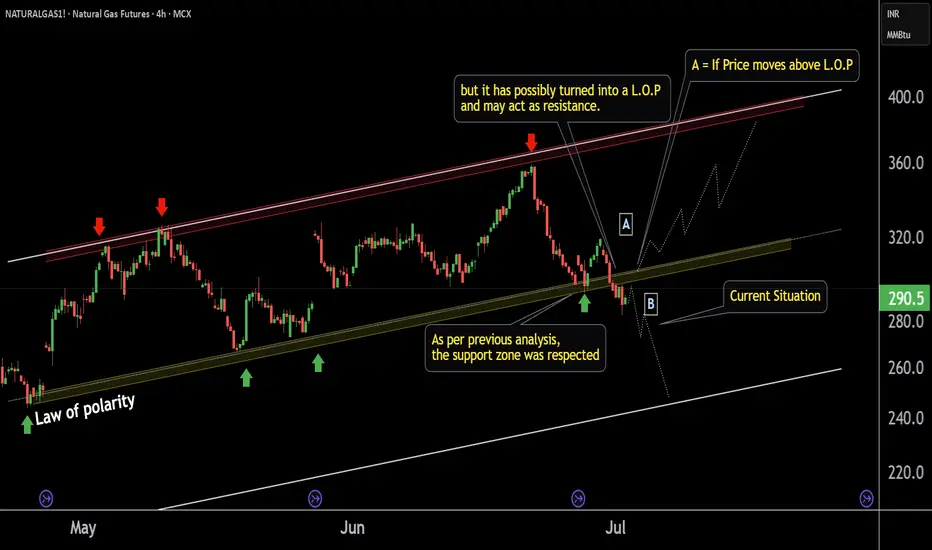
NATURALGAS1! 's key Level |This is the 4 hour chart of NATURALGAS1!
NATURALGAS1! has once again started sustaining above
its LOP (Law of Polarity) zone near at 290-295
If This level is sustain then ,we may see higher prices again in NATURALGAS1!.
Thank You !!

NATURALGAS1! Short time Breadkdown Alert !!This is the 4 hour chart of Natural Gas Futures.
NATURALGAS1 has given a short-term channel breakdown; the previous support may now possibly act as resistance at 300 level.
The breakdown target is the lower boundary of the broader channel, which may now act as support near at 240 level.
If lop is sustain then we may see lower prices in NATURALGAS1.
Thank You !!
Possible decline in natural gas prices? Possible decline in natural gas prices?
Natural gas futures in the United States fell to $3.40/MMBtu, the lowest level in six weeks, due to increased production and subdued demand. Mild weather conditions reduced heating and cooling needs, favoring above-normal storage injections. On the supply side, average gas production in the 48 contiguous states increased to 105.9 bcfd in June, compared to 105.2 bcfd in May. In addition, LNG export demand weakened, with flows to the eight major US export terminals averaging 14.3 bcfd in June, down from 15.0 bcfd in May.
The European gas market is also experiencing a significant downturn. European natural gas futures fell more than 10% to €33.3 per megawatt hour, reaching their lowest level in over a week, following the announcement of a ceasefire between Iran and Israel by US President Donald Trump.
The importance of weather conditions
Meanwhile, weather forecasts indicate a mixed picture across Europe. A heatwave is affecting the southern and western regions of the continent, with temperatures reaching 40°C in Madrid and 36°C in Zagreb, likely increasing electricity use for cooling. However, cooler and stormy conditions are expected in the Nordic countries and Eastern Europe due to a low-pressure system extending from Germany to the Baltic States.
The situation continues to deteriorate, with high production generating a surplus of supply on the market. This scenario could lead to new historic lows in prices, especially if the summer turns out to be cooler than expected. Analysis of the futures curve also provides negative indications. The curve is in a state of amplified contango, which occurs when demand is weak and supply is excessive.
Production is high
The shape of the futures curve is of considerable importance to speculators and investors seeking to mitigate risk through the purchase of commodities. It provides relevant indications of both the current state of the commodity market and its future prospects.
From a technical standpoint, the situation is negative: recent declines have been accompanied by above-average volumes, and prices are below the 200-period moving average. In light of this, we do not recommend buying natural gas, as prices are expected to reach new historic lows in the coming months.
However, it is important to consider that there is a current condition that could favor energy sector commodities.
The US dollar continues to weaken. Therefore, if I were to buy an energy sector commodity right now, I would opt for oil. Oil is generally priced in dollars on international markets, which means that when the value of the dollar falls, the price of oil tends to rise. This dynamic occurs mainly because a weaker dollar makes oil less expensive for buyers using other currencies, thus increasing demand and, consequently, the price.
The importance of a weak dollar
In addition, geopolitical events, such as conflicts in oil-producing regions, can affect both the price of oil and the value of the dollar. For example, tensions in the Middle East can lead to higher oil prices.
It is essential to monitor the geopolitical situation in the Middle East on a daily basis and analyze oil inventory data on a weekly basis to understand whether the market will continue in its current deficit phase. I expect a prolonged sideways phase for oil prices; therefore, it may be appropriate to invest in an undervalued oil sector stock that distributes dividends.

Gold | Oil | Dollar | Silver | Natural Gas Price Forecast.Gold | Oil | Dollar | Silver | Natural Gas Price Forecast.
NYMEX:NG1! COMEX:GC1! AMEX:UNG COMEX:SI1!

NATGAS: Forecast & Trading Plan
The analysis of the NATGAS chart clearly shows us that the pair is finally about to tank due to the rising pressure from the sellers.
Disclosure: I am part of Trade Nation's Influencer program and receive a monthly fee for using their TradingView charts in my analysis.
❤️ Please, support our work with like & comment! ❤️

NG1!: Target Is Down! Short!
My dear friends,
Today we will analyse NG1! together☺️
The in-trend continuation seems likely as the current long-term trend appears to be strong, and price is holding below a key level of 3.745 So a bearish continuation seems plausible, targeting the next low. We should enter on confirmation, and place a stop-loss beyond the recent swing level.
❤️Sending you lots of Love and Hugs❤️

NATURALGAS at Best Support Zone This is the 4 hour chart of Natural Gas.
Natural Gas having a good Support Zone at 290-295 range.
Natural Gas has shown a reversal from its support zone.
Natural Gas is trading within a parallel channel support at 293 level Natural Gas.
Thank You !!

Natural Gas Long positionNatural Gas will be ready for LONG position from 295 to 297 Labels, be ready to catch the move till 395 and above..........

NATGAS Will Collapse! SELL!
My dear friends,
Please, find my technical outlook for NATGAS below:
The instrument tests an important psychological level 3.896
Bias - Bearish
Technical Indicators: Supper Trend gives a precise Bearish signal, while Pivot Point HL predicts price changes and potential reversals in the market.
Target - 3.662
Recommended Stop Loss - 4.034
About Used Indicators:
Super-trend indicator is more useful in trending markets where there are clear uptrends and downtrends in price.
Disclosure: I am part of Trade Nation's Influencer program and receive a monthly fee for using their TradingView charts in my analysis.
———————————
WISH YOU ALL LUCK

NATGAS SUPPORT AHEAD|LONG|
✅NATGAS is going down now
But a strong support level is ahead at 3.450$
Thus I am expecting a rebound
And a move up towards the target of 3.600$
LONG🚀
✅Like and subscribe to never miss a new idea!✅
Disclosure: I am part of Trade Nation's Influencer program and receive a monthly fee for using their TradingView charts in my analysis.

NATGAS Long setupIf you like my Idea, Don't forget to Boost and comment on my Analysis. The recommendations are purely for educational purpose only, consult you financial advisor before trading.

Natural Gas | Oil | Dollar | Silver | Gold Price Forecast.Natural Gas | Oil | Dollar | Silver | Gold Price Forecast.
NYMEX:NG1! NYMEX:CL1! COMEX:GC1! COMEX:SI1!

NATGAS: Expecting Bullish Movement! Here is Why:
Remember that we can not, and should not impose our will on the market but rather listen to its whims and make profit by following it. And thus shall be done today on the NATGAS pair which is likely to be pushed up by the bulls so we will buy!
Disclosure: I am part of Trade Nation's Influencer program and receive a monthly fee for using their TradingView charts in my analysis.
❤️ Please, support our work with like & comment! ❤️

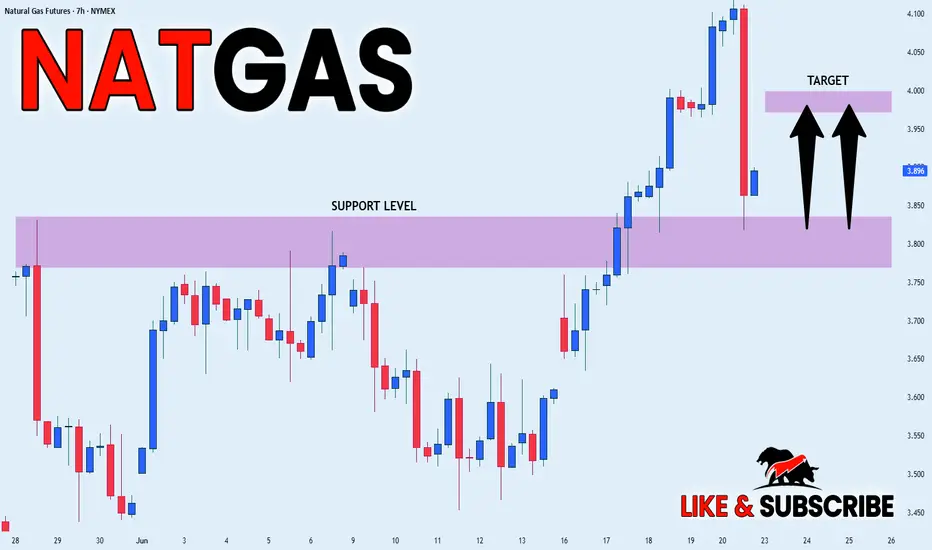
NATGAS REBOUND AHEAD|LONG|
✅NATGAS went down to retest
A horizontal support of 3.820$
Which makes me locally bullish biased
And I think that a move up
From the level is to be expected
Towards the target above at 3.984$
LONG🚀
✅Like and subscribe to never miss a new idea!✅
Disclosure: I am part of Trade Nation's Influencer program and receive a monthly fee for using their TradingView charts in my analysis.
NG1!: Bulls Are Winning! Long!
My dear friends,
Today we will analyse NG1! together☺️
The market is at an inflection zone and price has now reached an area around 3.894 where previous reversals or breakouts have occurred.And a price reaction that we are seeing on multiple timeframes here could signal the next move up so we can enter on confirmation, and target the next key level of 3.993.Stop-loss is recommended beyond the inflection zone.
❤️Sending you lots of Love and Hugs❤️

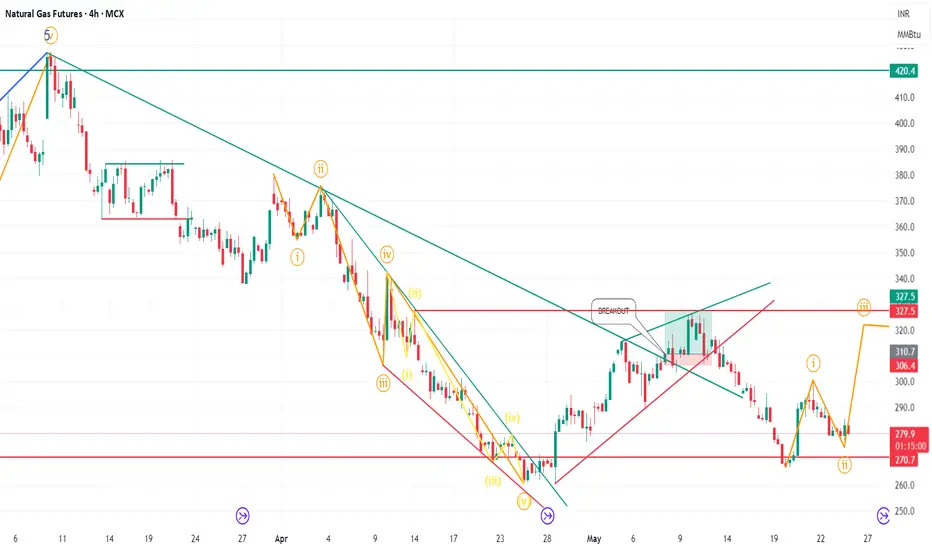
NaturalGas 3rd wave about to comeNaturalgas Making a 2nd wave on 4h Chart. It has also made a 2nd wave on Daily chart. Possible 3rd of 3rd on Monday.
Daily Chart:
Hourly Chart
15 Min Chart
NATGAS Long From Support! Buy!
Hello,Traders!
NATGAS made a great
Bearish correction and
And then retested a
Horizontal support
Around 3.800$ from where
We are already seeing a
Bullish rebound so we
Are bullish biased and we
Will be expecting a
Further bullish move up
Buy!
Comment and subscribe to help us grow!
Check out other forecasts below too!
Disclosure: I am part of Trade Nation's Influencer program and receive a monthly fee for using their TradingView charts in my analysis.

Will Middle East Flames Ignite Winter Gas Prices?The global natural gas market is currently navigating a period of profound volatility, with prices surging and defying typical seasonal trends. This significant upward movement is primarily driven by escalating geopolitical tensions in the Middle East, specifically the intensifying conflict between Iran and Israel, coupled with the looming potential for direct US military intervention. This complex interplay of factors is fundamentally reshaping perceptions of global energy supply and influencing investor sentiment, pushing natural gas prices towards critical psychological and technical thresholds.
Direct military strikes on Iran's energy infrastructure, including the world's largest gas field, the South Pars, have introduced a tangible threat to supply at the source. This is compounded by the strategic vulnerability of the Strait of Hormuz, a vital maritime chokepoint through which a significant portion of the world's liquefied natural gas (LNG) transits. Despite Iran possessing the world's second-largest natural gas reserves and being the third-largest producer, international sanctions and high domestic consumption severely limit its export capabilities, making its existing, albeit modest, export volumes disproportionately sensitive to disruption.
Europe, having strategically pivoted to LNG imports following the reduction of Russian pipeline gas, finds its energy security increasingly tied to the stability of Middle Eastern supply routes. A prolonged conflict, especially one extending into the crucial winter months, would necessitate substantial LNG volumes to meet storage targets, intensifying competition and potentially driving European gas prices higher. This environment of heightened risk and volatility also attracts speculative trading, which can amplify price movements beyond fundamental supply-demand dynamics, embedding a significant geopolitical risk premium into current market valuations.
This confluence of direct infrastructure threats, critical chokepoint risks, and Europe's structural reliance on global LNG flows creates a highly sensitive market. The trajectory of natural gas prices remains inextricably linked to geopolitical developments, with potential for further substantial increases in an escalation scenario, or sharp reversals should de-escalation occur. Navigating this landscape requires a keen understanding of both energy fundamentals and the intricate, often unpredictable, currents of international relations.

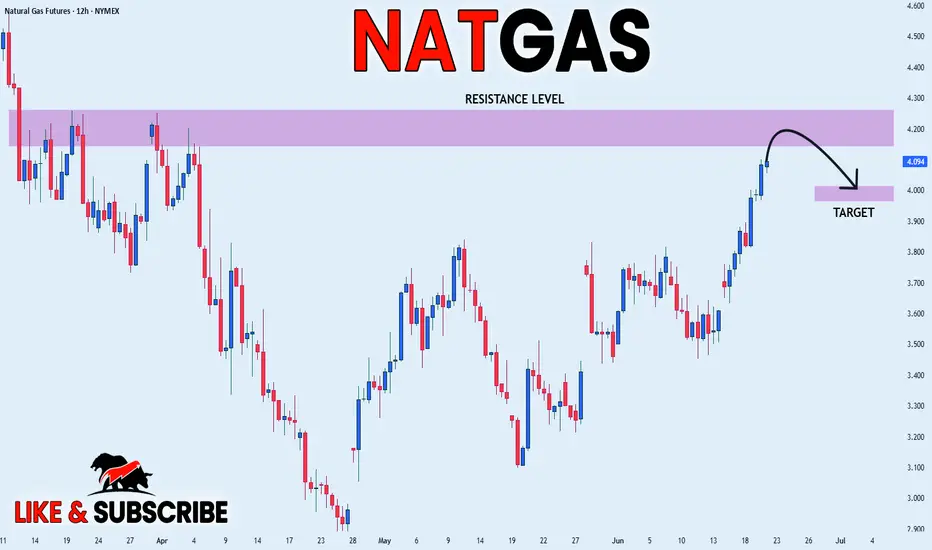
NATGAS STRONG RESISTANCE AHEAD|SHORT|
✅NATGAS has been growing recently
And Gas seems locally overbought
So as the pair is approaching
A horizontal resistance of 4.256$
Price decline is to be expected
SHORT🔥
✅Like and subscribe to never miss a new idea!✅
Disclosure: I am part of Trade Nation's Influencer program and receive a monthly fee for using their TradingView charts in my analysis.