Macro Oil Blueprints: Energy Schematics forged in FibonacciThis chart consists of USOIL, Heating Oil, Gasoline, Natural Gas, Palm Oil, and Rubber futures.
Every one is tailored to a Fibonacci Layout. There are two sets of extensions. They interlap and work together. One must look for the support and resistance to verify its authenticity.
QG1! trade ideas

Natural Gas Buy Natural Gas will break and touch 223.8, travelling channel and inside a big channel. so buyers are ready to pull above.

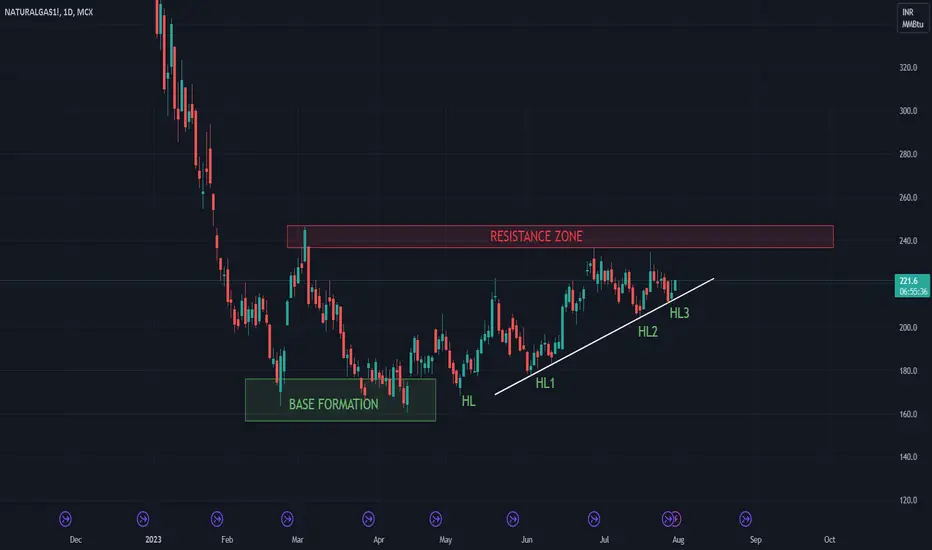
Long GAS | Potential Double Bottom formation at play _target $3A famous trader called this the "Widow Maker" due to how volatile Natural gas tends to be. The weekly closed on 0% change, showing some base formation. A double bottom pattern is a classic technical analysis charting formation that represents a major change in trend and a momentum reversal from a prior down move in market trading. The 1st target is at the resistance line and offers swing traders a nice 36% before confirmation of setup.
Disclaimer| Position open

NG1!: Bears Will Push Lower
The strict beauty of the chart is a reflection of the fierce eternal battle between the bulls and bears and right now I can clearly see that the bears are taking over so we will bend to the will of the crowd and sell too.
❤️ Please, support our work with like & comment! ❤️

Australian LNG Producers in High-Stakes Talks to Avert Strike...Australian LNG Producers in High-Stakes Talks to Avert Strike Amidst Climbing Energy Prices
Two prominent Australian liquefied natural gas (LNG) producers find themselves embroiled in crucial negotiations with unions, aiming to thwart a potential strike that could cast a shadow over global energy supplies.
The looming specter of industrial action across three strategic locations in Western Australia has reverberated through the energy market, prompting a startling 40% surge in European natural gas prices overnight due to mounting supply concerns. These three critical sites, jointly owned by Australia's Woodside Energy and American firm Chevron, collectively contribute 10% of the world's supply while also constituting half of Australia's LNG output.
Across Asia, the impact was palpable, as futures for liquefied petroleum gas on China's Dalian Commodity Exchange leaped by 6.7%, reaching Rmb4,276 ($597) per tonne on Thursday. Simultaneously, crude oil contracts in Shanghai experienced a 2.5% uptick, nearly reaching Rmb640 per barrel. In contrast, Europe's TTF benchmark gas price experienced a 9% decline, settling at €38.05 per megawatt hour on the same day.
Warren Patterson, Head of Commodities Strategy at ING in Singapore, noted that most of Australia's natural gas supply typically flows to Asian buyers. Should the strike continue for an extended period, it could lead Asian buyers to explore alternative sources, intensifying competition with European buyers.
Unions representing approximately 700 workers from Woodside and Chevron have sought "protected action ballot orders," a move that grants them the right to conduct votes on potential strike actions under Australia's Fair Work Commission.
Negotiations, focused on issues such as pay rates, job security, and working conditions for offshore gas workers, continued between the Offshore Alliance union and the two energy giants. While the negotiation stages with Woodside and Chevron vary, prospects of industrial action loom large toward the end of August, potentially extending for months if resolutions aren't reached.
Recent history serves as a reminder of the potential consequences, as a 76-day strike at Shell's Prelude facility last year resulted in a staggering A$1.5 billion ($980 million) loss in production costs. The union negotiators cite this example as a testament to the tangible impact of their actions.
Brad Gandy, spokesperson for the Offshore Alliance, emphasized that members are striving for a fair and reasonable agreement, aware of the substantial financial implications that protected industrial action could impose on the export of Australian gas.
Both Woodside and Chevron are prepared with a range of contingency plans to mitigate supply disruptions. Woodside reassured its commitment to secure energy supply and employee security, while Chevron reiterated its ongoing efforts to find mutually beneficial outcomes.
As the energy market holds its breath, the outcome of these high-stakes negotiations could indelibly reshape the trajectory of global energy supply chains, reverberating across continents and industries alike.

NATGAS Local Short From Resistance! Sell!
Hello,Traders!
NATGAS shot upwards but
Has hit a horizontal resistance
Level of 3.017$ from where
I think we will see a local
Bearish correction
Sell!
Like, comment and subscribe to help us grow!
Check out other forecasts below too!

Bobby's homework assignment8.9.23 In this video I did some follow-up on the ES and natural gas one other market.
If I have time later, I would like to talk a little bit about silver and gold. And I would be looking for a possible buy signal in coffee... but we're not quite there yet. Oil Is bullish... but there wasn't time to discuss it on this video.... but it doesn't mean you should open up your computer and enter along position at this trade location.

NATGAS Breakout, Testing ResistanceNatGas is up +7% this morning as price has breached local resistance near $2.90 and testing long-term resistance near $3. Should price beat the $3 level the next move will likely be up toward the 200-day moving average which rests near $3.40.
The PPO is reading short-term bullish momentum with the green PPO line crossing up through the purple signal line after both lines held above the 0 level on a recent pullback. Both lines trending above the 0 level indicates intermediate to long-term bullish momentum.
The TDI indicator shows the green RSI line trending above the upper Bollinger Band and rising above the 60 level which both indicate short-term bullish trend. Generally, you want to remain long when the RSI line is outside of the upper band, and when the RSI is rising or trending above the 60 level. Overall action in the RSI has been trending between the 40-80 levels since May which is a sign of intermediate to long-term bullish price trend.
Overall view on NatGas price is bullish with more gains expected as we head into fall/winter when demand tends to increase.

BearishSee in Chart..
See in Box candle
Same uptrend showing in both side..
So if this time NG not cross above 2.789.
Chances down again 2.5 or below..
Let's see..

NATURAL GAS BULLISHSee in Chart..
Natural Gas trend up..
See Fibonacci level..
Buy level around 230 and SL 215
upside expected till 250/265/280+


Long on natural gasSeeing that the situation continues between Russia and Ukraine, gas will keep on going to bigger levels until another country takes the head approach on distribution.
I'll keep on looking at supports and resistance levels.

Winter is coming - NATGAS will riseThe inverse bullish divergence in NATGAS suggests that the price of the important energy carrier will rise significantly soon.
To that extent, this forecast harmonizes with the seasonality.
As a first target, we therefore choose the order block at just under 3,800.

Nat Gas an Expanding Wedge offers an upside bias Mixed and volatile trading has resulted in an Expanding Wedge formation being posted on the intraday chart. This pattern has a bias to break to the upside. On a break through 2.656 the measured move target is the previous swing high at 2.794.
With bespoke resistance located at 2.621, there is ample scope for a corrective dip to the downside before the impulsive rally begins.
It should be noted that with a confluence zone located at 2.847, we could extend higher and the initial target level.

Bull flag or bearish channel?I don't know. Could be a bearish channel. I mean....
1. Half the world is on fire right now.
2. Europe is seeing record heat with no end in sight.
3. 1/3 of US has heat warnings
4. Some little Mexican guy named El Niño wants to kill us all
5. North Atlantic surface temps never been this high
6. In Phoenix, you can fry an egg on your wife's ass
7. All the idiot tech bro's that moved to Austin from San Francisco now regretting it.
breaks 2.70ish = gap fill to $3

Natural Gas and Stock market 7 Mega Cap Stock AnalysisQQQ daily downtrend confirmed
SPY hasnt
SMH weaker today compare to QQQ

NatGas: Take-off 🛫The price of NatGas has gained significantly again since Friday and could thereby move further away from the support at $2.48. Thus, we assume that it has already left the white wave (2) and is ready for high flights. For the white wave (3), it must rise significantly above the resistance at $2.75. After the completion of this wave, we expect a small correction and then another significant rise in the form of the white wave 5. Hence, we see a lot of movement on the upside at the moment. However, it should be noted that there is still an alternative scenario with a probability of 28%, which occurs if the price now falls contrary to our expectations. Then it would first have to fall below the support at $2.48.

NATURAL GAS Natural Gas brakes above resistance zone it can be a blast because from september onwords demand will increase in europian continent due to winters.
Natural Gas & SPY QQQ & 7 MEGA Cap Tech Stocks Analysisinside bar for stock market thursday low and high is key for me which way we break

Bob assignmen: Tesla Natural Gas7.27.23 In this video I tried to show how Tesla is likely to move lower even though it corrected higher to a 382 level and it also retested a gap lower..... in other words it's likely to go lower even though it has had Corrections higher. Follow it and paper trade It so you become familiar with markets that don't look so good until you know what a good market looks like.... but you don't want to start trading this until you develop A comfort level because you've seen it work two or three times first.... before you plunge into the water with fear because you haven't let these behaviors sink in first. It's much easier to follow the paper so you're not focused on the fear of loss. You're constantly fearing that you will lose it's your way of telling you that you don't trust you're analysis... but you're willing to be afraid. You shouldn't do it this way.
The next market Is natural gas which is already started moving higher Suggesting that this is going to be a good long-term trade Because of all the failures to make new lows..... so the market May correct lower and it may be a little difficult to decide if you're going to take a trade where the market is today... and by definition you're not going to pick the very bottom because that happened Weeks ago.... but this will probably develop into a good swing higher.... A good market to follow for the right trade location to go along.

part 2 of 7 natural gas & mega cap tech and QQQ SPYnatural gas weekly uptrend still intact key battle zone now

NG1!: Will Keep Growing! The Next Goal is: 2.800
The recent price action on the NG1! pair was keeping me on the fence, however, my bias is slowly but surely changing into the bullish one and I think we will see the price go up.
❤️ Please, support our work with like & comment! ❤️

NG1: In anticipation of a high flightOn the chart, we see a good consolidation, after which we will see a powerful upward rally. A triple bottom has been formed, which also serves as a harbinger of a future rally. I expect a move to 4.12 after exiting the consolidation channel.
All success and profit. If you liked it - subscribe.
