ACI. Long in the box. I have projections lower on this stock. My projections are from my proprietary fib pull and very accurate. The yearly chart trend has a lower high than the all time high and we can expect to make new lows. if we hold the previous lows and start to gain levels, this entry would be invalidated.
I wouldnt long this stock unless we get to the box. Too much risk to the downside to justify taking a position before the lows are cleared out.
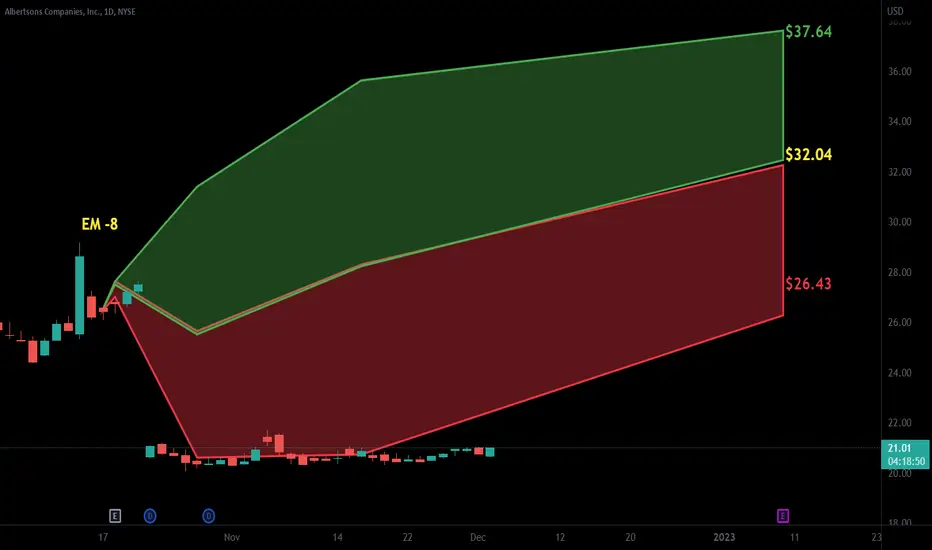
ACI trade ideas

$ACI LongI am getting long NSE:ACI on this channel break. Starting my position with less than 1% of my account as I believe it will continue lower with the trend. As always, I will continue to add on the next signals.

ALBERTSONS Stock Chart Fibonacci Analysis 022424Trading Idea
1) Find a FIBO slingshot
2) Check FIBO 61.80% level
3) Entry Point > 21.2/61.80%
Chart time frame : D
A) 15 min(1W-3M)
B) 1 hr(3M-6M)
C) 4 hr(6M-1year)
D) 1 day(1-3years)
Stock progress : C
A) Keep rising over 61.80% resistance
B) 61.80% resistance
C) Hit the bottom
D) Hit the top
Stocks rise as they rise from support and fall from resistance. Our goal is to find a low support point and enter. It can be referred to as buying at the pullback point. The pullback point can be found with a Fibonacci extension of 61.80%. This is a step to find entry level. 1) Find a triangle (Fibonacci Speed Fan Line) that connects the high (resistance) and low (support) points of the stock in progress, where it is continuously expressed as a Slingshot, 2) and create a Fibonacci extension level for the first rising wave from the start point of slingshot pattern.
When the current price goes over 61.80% level , that can be a good entry point, especially if the SMA 100 and 200 curves are gathered together at 61.80%, it is a very good entry point.
As a great help, tradingview provide these Fibonacci speed fan lines and extension levels with ease. So if you use the Fibonacci fan line, the extension level, and the SMA 100/200 curve well, you can find an entry point for the stock market. At least you have to enter at this low point to avoid trading failure, and if you are skilled at entering this low point, with fibonacci6180 technique, your reading skill to chart will be greatly improved.
If you want to do day trading, please set the time frame to 5 minutes or 15 minutes, and you will see many of the low point of rising stocks.
If want to prefer long term range trading, you can set the time frame to 1 hr or 1 day.

ACI Albertsons Companies Options Ahead of EarningsAnalyzing the options chain and the chart patterns of ACI Albertsons Companies prior to the earnings report this week,
I would consider purchasing the 23usd strike price at the money Calls with
an expiration date of 2024-2-16,
for a premium of approximately $0.92.
If these options prove to be profitable prior to the earnings release, I would sell at least half of them.

Unveiling Profit Potential - Targeting Buyside Liquidity Hello, fellow traders! Today, I am excited to present a trade idea that focuses on capturing the potential upside by targeting buyside liquidity. This opportunity offers an enticing entry point and takes advantage of sellside liquidity on the M15 timeframe, ensuring a favorable risk-reward ratio.
Based on careful analysis, I have identified significant buyside liquidity positioned above the current price level. This area represents a potential target for this trade, presenting an opportunity to profit from an upward price movement.
To optimize your entry, I suggest considering a strategic entry point at 20.34. This level aligns with the analysis, indicating a favorable entry position that aligns with the expected price trajectory.
Moreover, on the M15 timeframe, sellside liquidity is observed, which can act as a supportive factor for our trade. By placing a stop loss at 20.08, we position ourselves below the mean threshold of the M15 order block, effectively managing potential downside risks.
It is important to note that executing this trade involves careful risk management. Assess your risk tolerance and position size accordingly, ensuring that your risk exposure is within your comfort zone.
Please be aware that market conditions may change rapidly, and it is essential to adapt your strategy accordingly. Regularly monitor the trade's progress and adjust your stop loss or take profit levels as needed to optimize your trade management.
Remember, learning from real examples is vital to understanding trading concepts better. Therefore, I have provided detailed chart examples and clear markup to assist your comprehension of the trade setup.
Please note that trading involves inherent risks, and it is essential to conduct your own analysis and seek professional advice when making trading decisions.
Wishing you success and profitable trades!
TRADING as a BUSINESS

Grocery gap fillNice little ascending triangle formation after a big gap down. Locking in some profit at 24 bucks and moving up stop (price action resistance and the 200 SMA will be right in that area as well) and will take some more around $27. After that if it still looks like it has legs I'll trail a stop. 1.5% risk on this one.

Look for BuyHello,
Albertsons Companies, Inc. is an American grocery company founded and headquartered in Boise, Idaho. With 2,253 stores as of the third quarter of fiscal year 2020 and 270,000 employees as of fiscal year 2019, the company is the second-largest supermarket chain in North America after Kroger.
First Quarter of Fiscal 2022 Highlights . First quarter of fiscal 2022, which ended June 18, 2022.
Identical sales increased 6.8%
Digital sales increased 28%
Net income of $484 million, or $0.84 per share
Adjusted net income of $582 million, or $1.00 per share
Adjusted EBITDA of $1,420 million
The stock chart shows we are in a good place to buy this stock with targets at USD 37.27
Good luck


$ACI with a Bullish outlook following its earnings #Stocks The PEAD projected a Bullish outlook for $ACI after a Positive Under reaction following its earnings release placing the stock in drift A.
i think it fills1. daily - above prior high low
2. weekly - above
3. monthly - above
prior similar move..gap was filled

WATCH $ACIBearish
- Double tops
- Inverse head and shoulders
- Inverse cup and handle
- Bear flag
- Broke down neckline
- Broke down trend line
Everything bearish appeared here.
“A quitter never wins and a winner never quits.”

ACIPotential long setup in case today was a fluke. Not betting on it, but always open to possibilities. Below $28 & you can scrap this idea imo. Bearish RSI divergence noted.

ACI bullish swingtradeEnrico likes this trade so much, he is calling it a Good spot for a 10 ema swing strategy. I like the volume, location, candle, company, pumpernickle bread... get that discount.

ACI Looking Weak Earnings are scheduled to be announced on the 28th for ACI.
Very poor technical setup for ACI, anything less than a phenomenal earnings report should send the stock tumbling down to support at the 21 level. I'm entering a short on ACI as soon as I see a retest of 26.00 and then a follow-up confirmation of lower price action.

WATCH $ACLBearish
Fundamental
- High inflation macro environment / weak sentiment
- Funds Distribution
- Decent PE
- Negative PEG
- Decent P/FCF
- Strong Industry
- Supply and demand playing catch up ( over stocking )
Technical
- Momentum Theory Indicator - bearish divergence on the daily
- Price action formation ( rising wedge ) = diminishing bullish momentum
- Double tops
- Broke 2 years upward Trend line and rejected
- Price below 200MA
- Price above double top neckline / resting on major S/R
Entry idea
- Entry idea was based on few confluences
- A rebound to retest the upward trend line or 0.5 fibo
- A breakdown below the neckline and a retest
Stop loss depending on entry and risk appetite. But always set meaningful stops.
"if you cannot do great things,
do small things in a great way"
Cheers and happy trading!

ACI bullish swingNice bear candle closing above the 10 ema. ALSO, this was a bear candle that gapped up and closed into a bear candle. Calling this one a bear shat. ;-)
Let's see what happens. People have to eat?


aci ....................
sell
▪️dlinaya uzkaya protorgovka
▪️podhod k kruglomu chislu malenkimi barami - razvorot
▪️3 bara protiv trenda - razvorot
▪️AO v zone
...................

ACI primed for ATHACI reporting earnings of 0.75 (+0.11) with another earnings beat.
Strong technicals show a good bounce from an initial gap down.
● Bouncing from the 50 and 100 MA zone
● Bounce from 0.5 Fibonacci level from the January low to March high
● Gap down to fill. A similar gap down was observed and filled at the end of march
● Gaps are also nicely positioned between Fibonacci pivot points.
TP1 @ 35
TP2 @ 38
TP3 ATH

ACI - TAKE 10% PROFITS Published this trade last week, now is time to take profits and make your money

ACI (Albertsons) long positionACI or Albertsons has passed above the 50 day SMA and has followed a specific pattern for it to have a breakout going up to new highs or up to previous high.


Albertsons - as an inflation hedge?Several of my golf buddies are spun up over inflation worries. They point to the price of OSB (engineered wood similar to particle board) and other building materials.
I've opened a position in $ACI with a long-term time horizon, and as a play on Food Price Inflation.
Might just be a good trade idea (minimum 3 - 6 months) that pays a dividend.
Note: couldn't bring myself to by Kroger for personal reasons, and would have preferred Publix if it was available.
