Long on AES - HarmonicsDropping from 29$ levels in year 2022 and now its near bottom and ready for reversal. Stock has a good dividend yield of 6% and can return 50% in next 2-3 years. With the given dividend yield and technicals , it offers good risk to reward ratio. Its trying to form reversal candle, lets see
Target 1: 14
Target 2: 16
AES trade ideas

AES | Bounce in Motion from Multi-Decade Support – 75% Upside 📍 Ticker: NYSE:AES (AES Corporation)
📆 Timeframe: 1M (Monthly)
📉 Price: $11.48
📊 Volume: 109.4M
📈 RSI: 40.20 (Oversold rebound zone)
🔍 Technical Setup:
NYSE:AES has just bounced from the lower boundary of a 30-year ascending parallel channel, a zone that has historically marked major long-term bottoms.
🟢 Green arrow: Rebound from long-term trendline support
📏 Targeting reversion to the channel median
🔹 Pattern context: Mean-reversion strategy inside macro uptrend
🧠 Trade Plan & Price Target:
✅ Entry Zone: $11.00–$11.50
❌ Stop-Loss: Close below $9.50 (channel structure breakdown)
🎯 Target: $20.00
→ 📈 Return: +75.6% from current levels
⚠️ Key Insights:
RSI near historical bounce zone (40)
Major volume surge may signal capitulation
AES is historically cyclical within this macro structure — mean reversion is likely
Short interest elevated — potential for short-covering rally
💬 Will AES power a multi-quarter reversal like it did in 2002, 2009, and 2020?
📈 Add it to your radar if you’re watching for long-cycle rebounds.
#AES #MeanReversion #LongTermChannel #Utilities #ValueTrade #TargetTraders

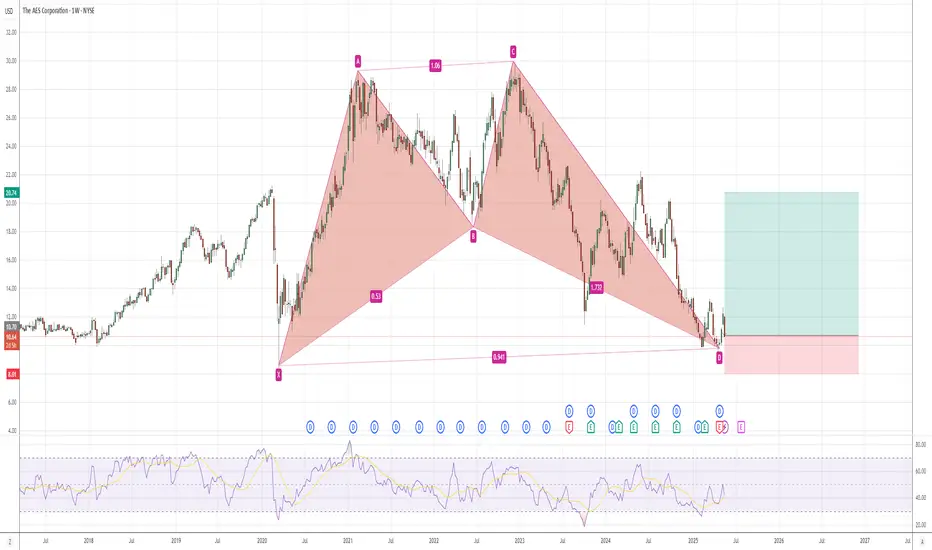
Strong buy on AES - Why I'm buying?Today, I’m entering a position in AES Corporation (NYSE: AES)—a **fundamentally strong, undervalued company that pays dividends**.
AES has a solid business model, strong cash flow, and strategic growth in the energy sector.
Harmonic patterns indicate an ideal buying opportunity, further confirmed by negative divergence on the RSI indicator.
I expect not only capital appreciation but also passive income through dividends, with strong upside potential in the coming months.
I see significant growth ahead—now is the perfect time to enter.
AES LONGEying this Adam & Eve Pattern, Volume seems to be in harmony with more upside. IF we see movement W/ Volume past the res line, Ill be a buyer targeting $15+.

AES finally found the bottom?NYSE:AES closed above a short term resistance level on 2/18/25. Could be bottom of multi-year downtrend... next resistance level ~$10.82. Would get long if AES can hold above this level on good earnings report. Clear sailing until the $11.42 level after that. Would like to see volume pick up for further confirmation.

AES Spencer Buster turned me on to this.I'm gonna start putting some charts on here for reference. Just so I can look it back on them and see if I'm right or wrong. We'll see. Push them up. People.

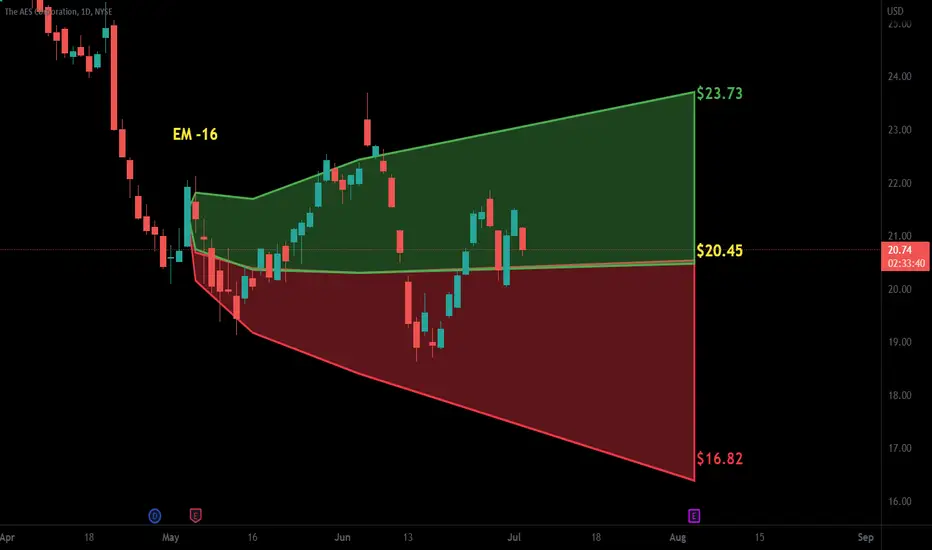
AES Corporation - Short term view with strong supportSo first of all both price and indicators are confirming the downtrend.
Today NYSE:AES opened with a gap succeeding yesterday's equilibrium in price with doji candles.
The price is still in the middle of the regression line and in the next few days the price don't seems to be close to upper 2 SD.
In the print above the yellow line shows the support at $11.43. The image's time horizon starts at the end of 2006.
Furthermore looking at short ratio available online the value is about 2,7 from mid October as well as more than 22M short interest

AES - long position (1D)Hi traders,
Long position on AES (1D), based on the trend reversal suggested by the Williams Alligator and by the divergence with the RSI. We backtested this strategy in the last two years, entering long or short only when the price closed above (for long) and under (for short) the line of the teeth (red line). When this happened there was usually a crossing of the lines of the indicator. We put our take profit where the price hit a support/resistance or when a candle closed under the red line (close long position) or above the red line (close short position). We put our stop loss at the level of the resistance/support or when, after the crossing of the lines of the Alligator, a candle closed under the red line (for long position, closing with a loss) or above the red line (for short position, closing with a loss). This strategy gave a return of 83.4% since January 2024.
we will open the short position if the price will close above the red line. In this case the stop loss will be few cents under the support level and the take profit will be at the level of the previous resistance. In any case we should close our position if the price will close under the red line.
Good luck!

$AES - Looks to be bottomingNYSE:AES looks to be bottoming. The oscillators are curling up. The chart shows two oscillators, but the rest of the oscillators are all turning up.
The targets and potential drop area are shown on the chart. Target 1 would be a tough resistance as it is in the POC region, so there is a possibility of rejection around that level.
Bear in mind that if the triangle pattern plays out, the measured move upon breakout is $30.
As always, I share my opinions and trades. I'm not suggesting that anyone follow my trades. You do you.

Long setup As shown on the chart. If the highs of the last days will be broken (it may happen today) then my buy stop limit gets triggered. Expecting and extensive upward move during the next weeks. We'll see.

AES - Bull Opportunity I see the structure presented as a bullish one that will likely act with an upward response when the green line is hit or even a bit before that.
The prior top also printed a higher high which is another good bull sign.
Bullish entry!
Hourly chart

AES - BullishBuy at the break of trend line and ride it to 17 TP1 or 18 TP2
Keep in mind there is earnings coming up in May
Good luck

$AES. Bearish CrossoverNYSE:AES shows on the daily chart a box right below a bearish crossover.
The EMA 21 looks ready to move the price lower.

AES и ГИПNYSE:AES показывает нам голову и плечи с пробитием уровня шеи и его ретестом, шортовая позиция с нынешних цен будет оправдана, тем не менее в случаи неудачи у нас есть стоплосс на уровне 21,8, в случаи удачи можно собирать профит по дороге на 14 баксов.

AES Potential ReboundBased on the chart, the stock formed a higher low on 9 June 2023 and start to move higher today and break above MA20. Not only that, the stock starting to move up from oversold region. This might be a good start for this stock.

AES | Global Energy Companies ==buy signalFriday give away
AES | Global Energy Companies ==buy signal
www.aes.com
AES is a global energy company that creates greener, smarter and innovative energy solutions. Together, we can accelerate the future of energy.

AES breaking out to the UPSIDEAES Corp recently offered a BUY signal with an ascending profit target.

AES Golden CrossAES made a "golden cross" on 9/1 and the daily candle made a bullish engulfing candle.
In addition the Bullish Engulfing candle closed above the (weekly) descending trend line of the triangle.
OBV crossed above its 9 day EMA and the 13 day FI recently crossed zero suggesting momentum is accelerating.
Stop: 2XATR ($24.59)
Target: $28.89 (prior resistance)

AES - Another Look at the Symmetrical TriangleSymmetrical Triangles tend to break out bullishly
Another trend line can be drawn at the 'mouth' of the symmetrical triangle
This allows a break out curve (double curve) to be drawn out of the triangle

$AES with a Bearish outlook following its earnings #Stocks The PEAD projected a Bearish outlook for $AES after a Negative Under reaction following its earnings release placing the stock in drift D with an expected accuracy of 83.33%.
$AES with a Bullish outlook following its earnings #Stocks The PEAD projected a Bullish outlook for $AES after a Positive over reaction following its earnings release placing the stock in drift B.

$AESNot risking much in this market.
Falling wedge along a horizontal support. Looking for a quick bounce to resistance before most likely heading lower with the market.
Daily classic bullish divergence on the MACD and RSI.
Stop = Below horizontal support.
Target = Horizontal resistance.

AES Bullish curveThe AES Corporation is a Fortune 500 company that generates and distributes electrical power. AES is headquartered in Arlington, Virginia
