WATCH $ALBBearish
Fundamental
- Inflationary macro environment / fear sentiment
- Funds Distribution
- High PE
- Decent PEG
- Decent P/FCF
- Strong Sector / Industry / Not Leader
- Decent earnings
- Decent fundamental
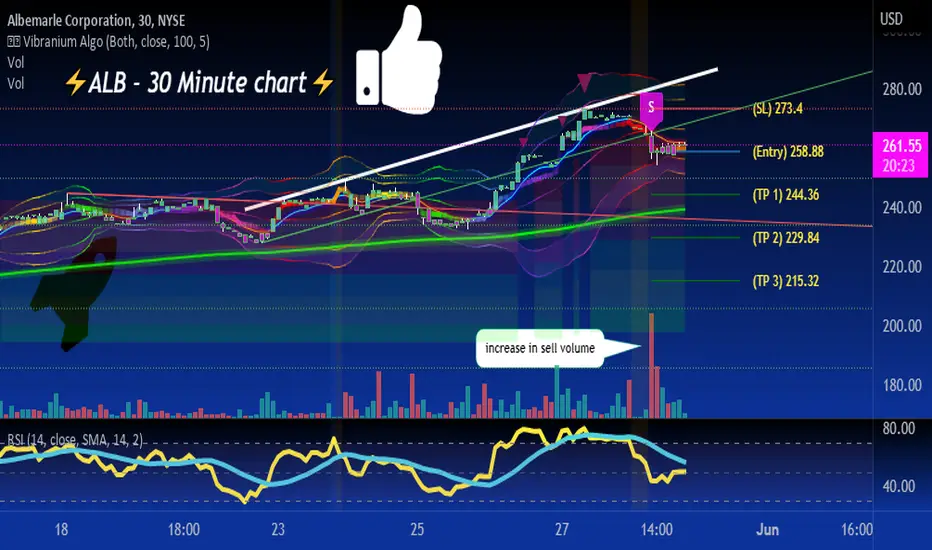
Technical
- Momentum Theory Indicator - H&S formation momentum
- Price action formation ( rising wedge )
- Broke upward Trend line and retest previous high forming double tops
- Price below 200MA
- High volume node at peak
- Potential cup and handle formation
Entry idea
- Entry idea was based on few confluences
- Break of neckline and retest
- Momentum broke neckline
Stop loss depending on entry and risk appetite. But always set meaningful stops.
"the distance between dreams and reality is called action"
Cheers and happy trading!
ALB trade ideas

$ALB New Up Trend?$ALB Looks to have started a new uptrend with a series of Higher Lows and Higher Highs. It looks to be right at a short-term resistance level. I have an alert just above today’s high which is also in the resistance area. If it can get over and close above 226 – 227 area, I will be looking to go long with a target area around 247. See markups on chart. This may be a good play for the EV space. Ideas, not investing / trading advice.

$ALB with a Bullish outlook following its earnings #Stocks The PEAD projected a Bullish outlook for $ALB after a Positive over reaction following its earnings release placing the stock in drift B with an expected accuracy of 50%.

ALB - Upward ChannelALB is within a strong upward channel on the Weekly chart
right now it is testing the upper band
A rejection may follow as has been seen in the past, leaving price to return to the 200MA in white
Price is still within a strong upward channel and should be treated bullishly

should see a small pullback 🦉ALB lower high on bigger timeframes and looking bearish on smaller ones as well.
we can target 244-229-215 in the next few weeks or so
ALB BreakoutALB Made New 6 Months Highs
Clean Text Book Base Breakout
5 Month Long Base
Heavy Volume coming in last 2 days
Price now trading above 200 DMA
Previous All Time Highs at 291.48, keep an eye on this level
Institutional Ownership: 84%
Institutional Transaction Last 3 Months: 3%
Measured Target: 325

$ALB Short IdeaALB big gap up before ER has me suspect... also technically it looks like FEB price action is still in a downward channel, and now there is a juicy gap below :)
I like the R/R on a short before ER's move.
Small size, picked up a few puts. Can also do bear spreads for less risk exposure.

$ALB#$ALB
At last yesterday broke the right shoulder high. And closed above too.
Today i will start a small position hopefully or on Monday depending on open today.
$ALB Getting BetterCheck my post on $ALB from last week.
This gotten better with the action last week.
Very nice head and shoulders bottom base on this one.

HigherPrice held long term up trend support and also broke the short term down trend! It should probably go back to test the previous high over the next few weeks/months ! Just my opiniom

5/18/22 ALBAlbemarle Corporation ( NYSE:ALB )
Sector: Process Industries (Chemicals: Specialty)
Market Capitalization: $27.636B
Current Price: $235.98
Breakout price: $243.05
Buy Zone (Top/Bottom Range): $231.20-$210.80
Price Target: $263.40-$265.50 (1st), $288.00-$291.50 (2nd)
Estimated Duration to Target: 86-90d (1st), 159-166d (2nd)
Contract of Interest: $ALB 9/16/22 250c, $ALB 12/16/22
Trade price as of publish date: $22.20/contract, $31.05/contract

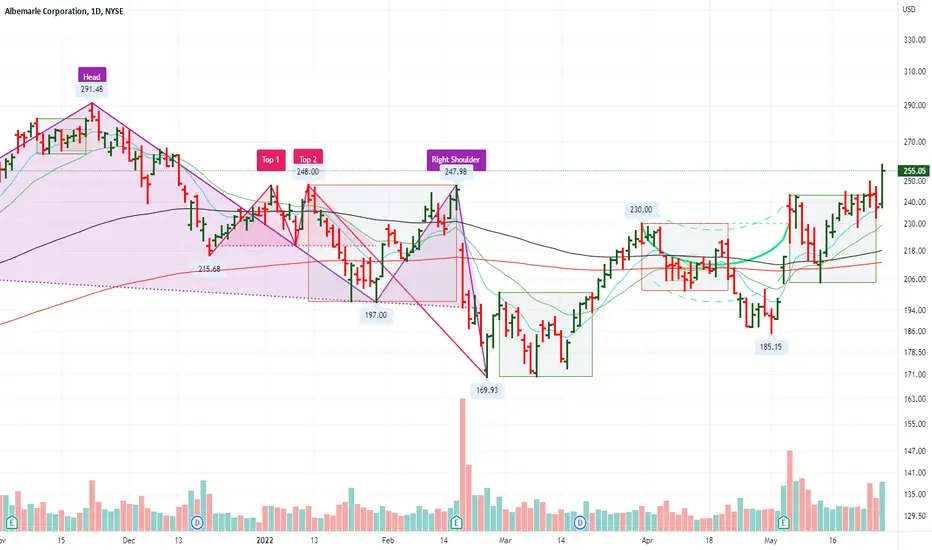
$ALB Head and Shoulders Bottom$ALB looking like its rounding up the right side of its base while the market is making new lows.
Characteristics of TMLs.
Starting to look like a head and shoulders bottom. Just need to tighten up below that supply line.
Worthy of your watchlist.

Albemarle - Swing trade opportunityToday, an opening gap appeared on the daily chart of Albemarle; as a result, this offers an opportunity for a simple trade setup. We are currently bearish on Albemarle and expect a complete retracement of the opening gap. Therefore, we would like to set a price target for Alb at 198.44 USD.
Illustration 1.01
Albemarle opened up almost 7%.
Technical analysis - daily time frame
RSI and Stochastic turned bullish. DM+ and DM- performed bullish crossover. However, we think these are false bullish signals. We conclude this from a low ADX value. The daily time frame is deceptive.
Illustration 1.02
The picture above shows the short-trade setup.
Technical analysis - weekly time frame
RSI, MACD, and Stochastic are all bearish. DM+ and DM- perform whipsaws, and ADX contains a low value. That indicates the presence of a very weak trend. Overall, the weekly time frame is bearish.
Please feel free to express your ideas and thoughts in the comment section.
DISCLAIMER: This analysis is not intended to encourage any buying or selling of any particular securities. Furthermore, it should not serve as a basis for taking any trade action by an individual investor. Therefore, your own due diligence is highly advised before entering a trade.

Lower!Price is now pushing down towards the 160 area level ! If you believe in the electric revolution, Albermale has a great potential due to its Lithium production (electric Batteries)! But just be patient and let the market come to you ! Just my opinion:)

Long ALB Corp.Long ALB at $203.75.
Bought some ALB shares when i opened up the chart today and saw it corrected down around 17%. Kind of knee-jerk reaction. I'm down after close today. Looking for a bounce at open or will ditch the play.

Albemarle (ALB) Is Currently At 205; Wait For Retracement At 215Last week I suggested shorting Albemarle (ALB) if it pushed through the many levels of support and closed below 215 in price.
Technical analysis in the form of chart patterns like descending triangles, double tops, multiple downward spikes, an increase in volume on the uptrend, and the Fibonacci retracement along with a close below a long-term upward trendline suggested that it was poised to fall.
We couldn’t for sure confirm that it was in a downtrend because it had not yet been established with the 1-2-3 method.
There was also a large head and shoulders pattern that was not confirmed. However, closing at 211 (price) on the 24th of January confirmed this pattern.
Your profits would have been massive if you had jumped in short 215 as I suggested and placed a tight stop just above one of my resistance levels (between 216 and 219). A bailout when the price reached its floor of 196, anything between 4.5 and a 9 to 1.
Take into consideration that all the confluence pointed to a massive drop, and in these situations, I like to keep my stop-loss tight to maximize profit-taking. It is risky, and there is a chance you may get stopped out, but that occurs with every trade. I was spot on in this scenario, and a 9 to 1 win is a pretty sweet deal.
Now, if you missed the trade and are kicking yourself (and you should be), don’t worry because the retracement is in progress. Using the Fibonacci retracement again, we can see that the 38% level is at 215, exactly right up against all those resistance (former support levels) levels.
It is highly unlikely that Albemarle (ALB) is going to recover from this price drop in the next couple of days.
We can now be on the lookout for a symmetrical triangle (created by the new low at 196) and a possible channel establishing the downtrend further.
If you are brave enough, you can put in a limit at 215 and place your stop-loss at 216. If prices drops to 196, your profits will be 19 to 1. Remember that besides having all the resistance at 215, 215 is a round number where many traders are possibly holding their position. This means that price will most likely find it difficult to move higher.
This also means that the price may not hit 215 because of the number of traders who have shorted there, so it's better to get in at 214.
A healthier (and smarter) trade would be to put your limit in at the Fibonacci retracement level of 38% (price 215) and put your stop-loss above the 50% Fibonacci level (price 221). This will give you ample stoppage room and space for the trade to breathe when it attempts to retrace to its highs.
This will prove difficult because of all the resistance in its way, though. Take into consideration that price may push to the Fibonacci 50% or 62% levels because of the channel forming before the drop continues.


Look To Short Albemarle (ALB) Stock If Price Falls Below 215CAPITALCOM:ALBES
Daily Timeframe Position
Albemarle (ALB) may be nearing the end of its uptrend since late March 2020. A long-term Trend Line from the valley in March moves upward against corresponding valleys signifying the uptrend (weekly timeframe). For the first time price has now dropped and closed below the trendline. Although it has closed below the Trend Line, and that may signal that it is not in an uptrend anymore, we have not yet confirmed that it is in a downtrend. To decipher this, we use the 1-2-3 trend change method.
1 - This is where the price has closed below the trendline
2 - There is a retracement and a retest of the high that fails
3 - A close below the closest valley to the breakout (However, this has not happened yet). If the price pushes past 215 and closes, then this is another signal that a downtrend is impending
Another short signal is the Double Top that has formed, which is compounded by strong selling (as you can see by the long shadows of the candles at the price range of 244). This Double Top has also been confirmed as we have a close below the valley between the two peaks (shown with the white dot).
Yet another signal is the Fibonacci retracement that shows a pullback at 50%.
We can see that price is hovering at a number of Support regions, including a Descending Triangle and Support at 215, which incidentally is also a round number. There is also Support Line formed for 215 from a smaller descending triangle to the left between September and October.
If the price breaks 215, we can most probably expect a sharp drop until resistance is reached at 185 provided by the Support line of the Broadening Formation. 185 is also coincidentally 15% away from the breakout price.
Placing your entry at 214 (past Support at 215) and taking profits at 185 will give you a 5.5 to 1, which is not bad at all. This is only if you place your stop relatively close to the Support that is keeping this price afloat, say at approximately 216/17. Consider taking profits rather at 194 just before the tiny bit of price congestion that appears in that Broadening Formation to the left. Price will most probably stall here and start to retrace, but you will be guaranteed a 3.5 to 1 . If done correctly, you can get out at this point, wait for the Fibonacci retracement at 62%, and short again if you see price is dropping further. If you are thinking of riding the downtrend, then placing your Stop loss at the 62% retracement from the valley peak when it starts to retrace is your best bet.

ALB LOOKs like a good buyAlbemarle Corporation is a fine chemical manufacturing company based in Charlotte, North Carolina. It operates 3 divisions: lithium, bromine specialties and catalysts
LOOKs like a good buy
just follow the signs
Albemarle Corporation Showing Signs Of StrengthIf price touches 220 again with rejection, this could be a starting point for another rally to the upside
N.B
- Let emotions and sentiments work for you
-ALWAYS Use Proper Risk Management In Your Trades

ALB Short in Short Term, Long in Long TermWatch for downward cross of moving averages, price finds support at the bottom of the channel and continues to rise from there.
Company is experiencing short term weakness along with broad sectors of the US Economy.
Market has been falling on news of new variant. General skittishness paired with portfolios rebalancing for 2021 year end make for extra selling pressure.
Albemarle will benefit from the strong tailwinds of rising commodity prices and increased demand for the elements they mine.

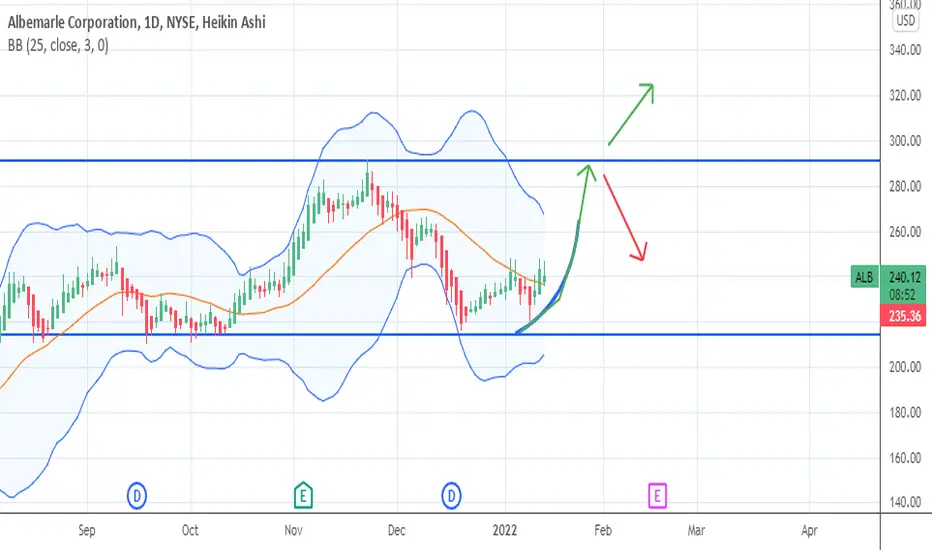
ALB - Albermarle CorporationNYSE:ALB
Idea is simple:
Long position when the price breaks out of flag and closes 1h or 4h higher than ($283)
Stop - close if the stock closes 1d lower than $283
Take - if it goes higher, place stop at $283 and watch the show
Feel free to comment / add a feedback

Bullish Sentiment This has been on a steady roll for over a year - heading into a Lithium boom in 2022 and 2023.
