American Tower (AMT) Q4 Earnings PreviewAmerican Tower (NYSE: AMT) will report its Q4 2024 earnings on Tuesday, February 25th, before the market opens. Analysts expect FFO of $2.51 (+36.63% Y/Y) and revenue of $2.51B (-9.86% Y/Y).
American Tower (NYSE: AMT) will report its Q4 2024 earnings on Tuesday, February 25th, before the market opens. Analysts expect FFO of $2.51 (+36.63% Y/Y) and revenue of $2.51B (-9.86% Y/Y).
The company’s Q3 results showed flat revenue Y/Y at $2.52B, with reduced 2024 guidance due to FX headwinds and the timing of its India operations sale
. AMT has since completed the sale of its India unit and agreed to sell its Australia and New Zealand operations for ~$78.2M.
Analysts project core organic revenue growth of ~5% in Q4, with FX fluctuations likely impacting 2025 guidance. Despite challenges, AMT remains a top pick for 2025 due to its diverse portfolio, reduced churn, and improving balance sheet.
Key Takeaway: AMT’s Q4 results will reflect its strategic shifts, with FX and international growth as key drivers.
AMT trade ideas

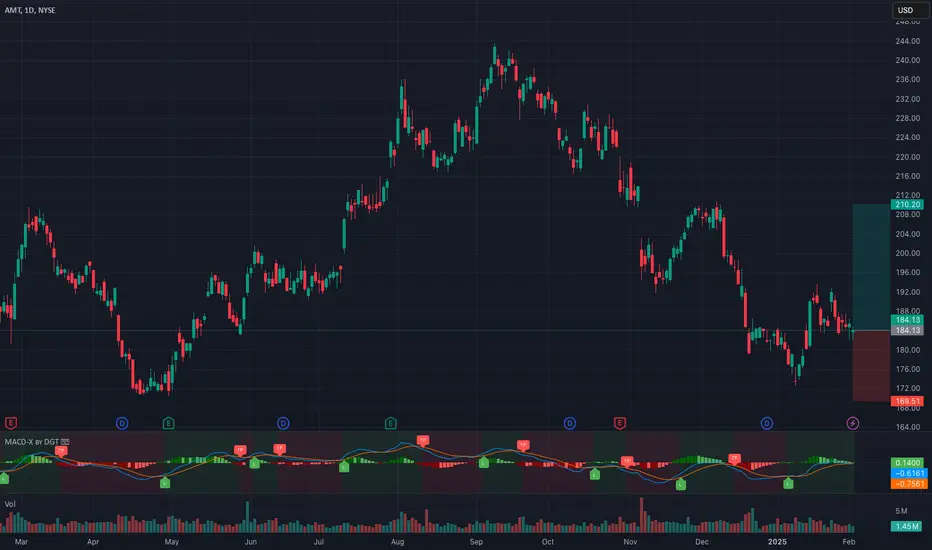
AMT in Sell ZoneMy trading plan is very simple.
I buy or sell when at three of these events happen:
* Price tags the top or bottom of parallel channel zones
* Money flow spikes beyond it's Bollinger Bands
* Stochastic Momentum Index (SMI) at near oversold overbought level
* Price at Fibonacci levels
So...
Here's why I'm picking this symbol to do the thing.
Price in selling zone above top of channels
Stochastic Momentum Index (SMI) at overbought level
Money flow momentum is spiked positive and over top of Bollinger Band
Target is lower channel around $186

AMT: A Solid Buy for 2025**AMT: A Solid Buy for 2025** 🏗📈💰
American Tower (AMT) is looking like a strong opportunity for 2025. As a leading REIT in the telecom infrastructure sector, it benefits from the ongoing 5G expansion and global demand for data. With a solid business model, stable cash flows, and a **dividend yield of ~3%**, AMT offers both growth and income potential.
📊 #AMT #REIT #Investing #Dividends #StockMarket
BEARISH on US30. 30 to 3rd January All indication shows US30(DOWN JONES) will close Bearish(WEEKLY) on Friday 3rd of January.
This is due to Technical and Fundamental Reasons.
I will be using this knowledge to correlate a more volatile stock AMT, I'm bearish on AMT.

AMT - Ready for a rally !AMT weekly turned very bullish, testing the trend line back and ready for the bounce.
Target 1 - 250
Target 2 - 280
Target 3 - 300
Stop loss - 180

AMT 1D Investment Aggressive trend TradeAggressive trend Trade
- short impulse
+ biggest volume T1
+ support level
+ volumed 2Sp
+ weak test
+ first bullish bar close entry
Calculated affordable stop limit
1 to 2 R/R take profit
1M Trend Trade
"+ long impulse
- far below SOS level
+ 1/2 correction"
1Y Trend Trade
"+ long balance
+ ICE level
+ support level
- too far before 1/2 correction
+ volumed Sp
+ test"

AMT Turn Around (About Time)?There's some reasonably good news from analysts and this one has been beaten down quite a bit. With a possible economic resurgence from the recent election, consider the support locations for key areas to place a bet.

Americam Tower ,,, Buying opportunity Uptrend
One of the beneficial strategies with the lowest risk is entry to position after a pullback especially if a good bullish candle formed on the support line/zone.
There is a good bullish candle as a trigger on the chart and it seems it could be a profitable position. Next targets are about 236 and 282 and as always, do not forget setting a sure SL for your trade.

Pullback in American TowerAmerican Tower spent most of 2024 underwater, but it’s shown signs of revival in recent weeks.
The first pattern on today’s chart is the pair of bullish gaps on July 11 and July 30. The first followed the lower-than-expected inflation report, which spurred hopes of rate cuts. The second followed strong earnings, revenue and guidance. Those jumps may reflect improving sentiment.
The later surge also lifted AMT above its $215.88 closing price at the end of last year. Prices have retraced most of that move but have remained above the old peaks. Holding this area may indicate that new support is established above old resistance.
Third, the 50-day simple moving average (SMA) had a “golden cross” above the 200-day SMA. That may suggest a longer-term uptrend is taking shape.
Finally, the wireless-tower company’s 8-day exponential moving average (EMA) is above its 21-day EMA. That may be consistent with a shorter-term uptrend.
TradeStation has, for decades, advanced the trading industry, providing access to stocks, options and futures. See our Overview for more.
Past performance, whether actual or indicated by historical tests of strategies, is no guarantee of future performance or success. There is a possibility that you may sustain a loss equal to or greater than your entire investment regardless of which asset class you trade (equities, options or futures); therefore, you should not invest or risk money that you cannot afford to lose. Online trading is not suitable for all investors. View the document titled Characteristics and Risks of Standardized Options at www.TradeStation.com . Before trading any asset class, customers must read the relevant risk disclosure statements on www.TradeStation.com . System access and trade placement and execution may be delayed or fail due to market volatility and volume, quote delays, system and software errors, Internet traffic, outages and other factors.
Securities and futures trading is offered to self-directed customers by TradeStation Securities, Inc., a broker-dealer registered with the Securities and Exchange Commission and a futures commission merchant licensed with the Commodity Futures Trading Commission). TradeStation Securities is a member of the Financial Industry Regulatory Authority, the National Futures Association, and a number of exchanges.
TradeStation Securities, Inc. and TradeStation Technologies, Inc. are each wholly owned subsidiaries of TradeStation Group, Inc., both operating, and providing products and services, under the TradeStation brand and trademark. When applying for, or purchasing, accounts, subscriptions, products and services, it is important that you know which company you will be dealing with. Visit www.TradeStation.com for further important information explaining what this means.

$AMT - big move, can it sustain?These fib levels acted as resistance 3 times on stronger moves up. Not sure what happened here but it’s over extended and just got smacked by fib resistance.
It did however form a bull chart when it broke out of the regression channel.
May consolidate here before filling the gap intraday before next move up but I see this going back to $200 before anything

$AMT at multi-YEAR support: Buyers are stepping in!NYSE:AMT is sitting at a level of significant support indicated by the white box. The $170 to $180 zone has been a zone of significant support in Feb 2019, March 2020, Oct 2022, and Oct 2023 (see circles). All touches of this area in the past have resulted in major bounces and marked major lows. Indeed, over $1.5M worth of 05/17/24 calls were purchased ABOVE ASK over the past two days.

AMT - sentiment cycle scenarioNYSE:AMT is testing the 0.786 level from the last swing high. Failure to hold makes it more likely that we continue lower. The pattern is very similar to Justin Mamis sentiment cycle.
If the current level fails to hold, a scenario completing this cycle would likely align to the concentration of volume between 136-145, and to the 1.272-1.414 fib retrace. If 172-173 holds it could rebound and make a move above 220, but momentum suggests that we're headed lower.

AMT Long Invest Conservative Trend TradeConservative Trend Trade 11
+ long impulse
+ SOS level
+ 1/2 correction
+ biggest volume Sp
Calculated affordable stop loss
1 to 2 R/R taket profit
Monthly Context
+ long balance
+ biggest volume expanding ICE
+ 2Sp- (previous bar touched ICE)
+ test
I'll see how market goes and can take potentially 1/3 at 1 to 2 R/R
1/3 at Daily resistance
1/3 at Monthly 1/2 of range

Report earnings to fall -25% to 94 cents per share on February 2The last earnings report on September 30 showed earnings per share of $1.26, beating the estimate of $1.13. AMT's P/B Ratio (19.531) is slightly higher than the industry average of (2.290). P/E Ratio (126.620) is within average values for comparable stocks, (58.760). Projected Growth (PEG Ratio) (2.616) is also within normal values, averaging (7.055). Dividend Yield (0.034) settles around the average of (0.071) among similar stocks. P/S Ratio (8.019) is also within normal values, averaging (6.554). With 1.42M shares outstanding, the current market capitalization sits at 88.54B.

AMT: bullish divergenceA price action above 188.00 supports a bullish price action.
Crossing below this level will negate the bullish stance.
Increase long exposure for a break above 194.00.
The target price is set at 200.00.
The stop-loss price is set at 184.00.
Testing its 200-day simple moving average, which might act as major support.
Bullsh divergence is also notable (see the lower panel).

Solid LONG TERM buying spot for AMT AMT, dividend paying cell phone tower REIT is at the 100/200 sma on the daily AND 100 sma on the monthly. :)

Pullback in American Tower American Tower ended 2023 by rallying from its lowest level in almost five years. Now, after a pullback, some dip buyers may see opportunity.
The first pattern on today’s chart is the price area between about $200 and 204. It marked the highs for AMT between May and July. The wireless tower company paused there late November before continuing toward $220. If this level holds, some investors may think old resistance has become new support.
Second, the 50-day simple moving average (SMA) had a “golden cross” above the 200-day SMA in mid-December. That may suggest the longer-term trend is getting bullish again.
Third, stochastics dipped to an oversold condition.
Fourth, fundamentals may be improving after quarterly results beat estimates on October 26. The stock could also potentially benefit from lower interest rates.
TradeStation has, for decades, advanced the trading industry, providing access to stocks, options and futures. See our Overview for more.
Important Information
Past performance, whether actual or indicated by historical tests of strategies, is no guarantee of future performance or success. There is a possibility that you may sustain a loss equal to or greater than your entire investment regardless of which asset class you trade (equities, options, futures or cryptocurrencies); therefore, you should not invest or risk money that you cannot afford to lose. Online trading is not suitable for all investors. View the document titled Characteristics and Risks of Standardized Options at www.TradeStation.com . Before trading any asset class, customers must read the relevant risk disclosure statements on www.TradeStation.com . System access and trade placement and execution may be delayed or fail due to market volatility and volume, quote delays, system and software errors, Internet traffic, outages and other factors.
Securities and futures trading is offered to self-directed customers by TradeStation Securities, Inc., a broker-dealer registered with the Securities and Exchange Commission (“SEC”) and a futures commission merchant licensed with the Commodity Futures Trading Commission (“CFTC”). TradeStation Securities is a member of the Financial Industry Regulatory Authority, the National Futures Association (“NFA”), and a number of exchanges. TradeStation Crypto, Inc. offers to self-directed investors and traders cryptocurrency brokerage services under federal and state money services business/money-transmitter and similar registrations and licenses.
TradeStation Securities, Inc., TradeStation Crypto, Inc., and TradeStation Technologies, Inc. are each wholly owned subsidiaries of TradeStation Group, Inc., all operating, and providing products and services, under the TradeStation brand and trademark. TradeStation Crypto, Inc. offers to self-directed investors and traders cryptocurrency brokerage services. It is neither licensed with the SEC or the CFTC nor is it a member of NFA. When applying for, or purchasing, accounts, subscriptions, products and services, it is important that you know which company you will be dealing with. Visit www.TradeStation.com for further important information explaining what this means.

AMT testing notable resistanceAmerican Tower Corp (AMT) presently exhibiting bullish momentum, however it is approaching notable resistance.
This resistance level is able to absorb monthly buying pressures and from here (AMT) can fall back to near-term support.
A weekly settlement above this resistance level would lead to another buy signal where gains of 15% would be expected over the following 2 - 3 months.

$AMT with a bullish outlook following its earnings #StocksThe PEAD projected a bullish outlook for NYSE:AMT after a positive over reaction following its earnings release placing the stock in drift B with an expected accuracy of 61.54%.

$AMT with a bullish outlook following its earnings #StocksThe PEAD projected a bullish outlook for NYSE:AMT after a positive under reaction following its earnings release placing the stock in drift A with an expected accuracy of 75%.

April Gainers (AMT, account up 0.32%)6th trade in April is NYSE:AMT .
Holding period is 45 days (2/24/23-4/10/23).
Account is up 0.32%.
Total return in April is 0.77%

AMT: mean reversion trade?A price action above 202.00 supports a bullish trend direction.
Increase long exposure for a break above 215.00.
The upside target is set at 240.00.
Stop-loss at 195.00. Negtat the trade foir a break below this level.
The MACD gave a bullish crossover recently, supporting a change in trend direction.
Furthermore, the price action is at the lower range of the linear regression channel pattern, which is sloping upwards (bullish trend).
This increases the likelihood of a mean reversion trade.
Trade expected to unfold over the next couple of weeks.

$AMT with a bullish outlook following its earnings #StocksThe PEAD projected a bullish outlook for $AMT after a positive over reaction following its earnings release placing the stock in drift B with an expected accuracy of 58.33%.
