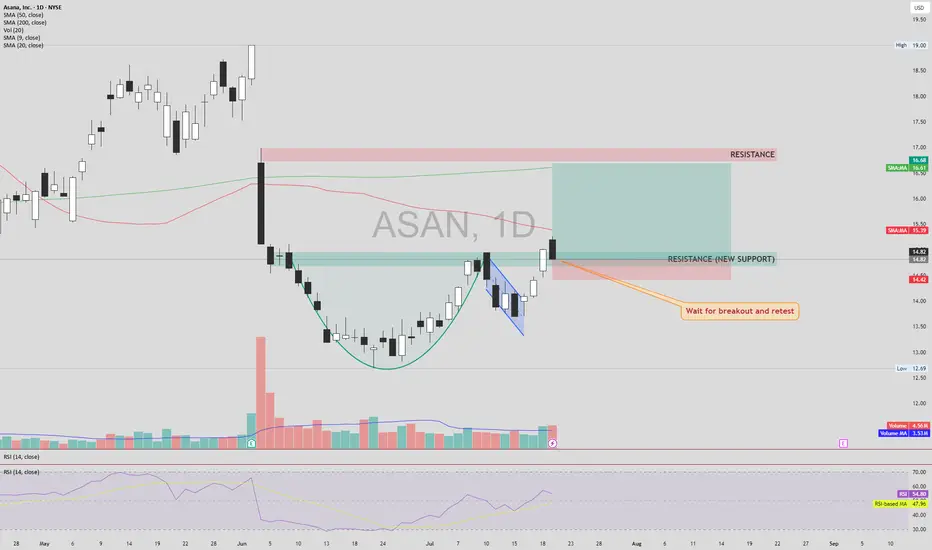
ASAN – Cup & Handle Breakout SetupASAN NYSE:ASAN has formed a classic Cup & Handle pattern and has broken above the neckline, turning previous resistance into new support. However, the price is still trading below both the 50 and 200 SMAs, which calls for cautious confirmation.
📌 Entry: Wait for a confirmed retest of the breakout level (new support) with healthy volume.
🔒 Stop Loss (SL): Just below the newly established support zone, in case of a failed retest.
🎯 Take Profit (TP):
First TP: Next visible resistance zone above.
If this level breaks and holds (confirmed by retest),
Next TP: The large gap overhead could potentially be filled.
This setup provides a strong risk-reward structure if confirmation aligns with volume and momentum. Avoid early entry without retest.
⚠️ DYOR (Do Your Own Research) – This is not financial advice.
ASAN trade ideas
ASAN is bullish for the next few weeks first target 18–20$ASAN is bullish for the next few weeks
Following my analysis, there is a strong probability that the stock will rise, although it's too risky to return to the market before the signal confirming the return of liquidity to the markets.
first target = 18 – 20$

$ASAN looking for a swing to range highOn the day I'm writing this, NYSE:ASAN (3b mc) just announced a new CEO after hours. His name is Dan Rogers, an SAAS veteran, previously holding executive positions of companies like ServiceNow (208b mc), NYSE:RBRK (17.5b), and LaunchDarkly (3b, private) during key growth phases.
73% of Fortune 500 companies use ASANA's services. The company I work at uses this daily and is a key part of keeping operations going. If ASANA mystically stopped working, it would be a huge fire.
Looking for a mid-long term swing near $23 and potentially beyond.

Long Trade Setup Breakdown for Asana, Inc. (ASAN) - 30-Min !📊
🔹 Asset: Asana, Inc. (ASAN)
🔹 Timeframe: 30-Min Chart
🔹 Setup Type: Bullish Breakout from Descending Triangle
🚀 Trade Plan (Long Position):
✅ Entry Zone: $22.89 (Breakout Confirmation)
✅ Stop-Loss (SL): $21.85 (Below Support)
🎯 Take Profit Targets (Long Trade):
📌 TP1: $24.05 (First Resistance)
📌 TP2: $25.36 (Extended Bullish Target)
📊 Risk-Reward Ratio Calculation:
📈 Risk (Stop-Loss Distance):
$22.89 - $21.85 = $1.04
📈 Reward to TP1:
$24.05 - $22.89 = $1.16
💰 Risk-Reward Ratio to TP1: 1:1.1
📈 Reward to TP2:
$25.36 - $22.89 = $2.47
💰 Risk-Reward Ratio to TP2: 1:2.4
🔍 Technical Analysis & Strategy:
📌 Breakout Confirmation: Strong buying momentum above $22.89 signals continuation.
📌 Pattern Formation: Descending Triangle Breakout, suggesting bullish movement.
📊 Key Support & Resistance Levels:
🟢 $21.85 (Strong Support / SL Level)
🟡 $22.89 (Breakout Zone / Entry)
🔴 $24.05 (First Profit Target / Resistance)
🔴 $25.36 (Final Target for Momentum Extension)
🚀 Momentum Shift Expected:
If price sustains above $22.89, it could push towards $24.05 and $25.36.
Higher volume breakout would confirm strength in the trend.
🔥 Trade Execution & Risk Management:
📊 Volume Confirmation: Ensure buying volume remains strong after breakout.
📈 Trailing Stop Strategy: If price reaches TP1 ($24.05), move SL to entry ($22.89) to lock in profits.
💰 Partial Profit Booking Strategy:
✔ Take 50% profits at $24.05, let the rest run to $25.36.
✔ Adjust Stop-Loss to Break-even ($22.89) after TP1 is hit.
⚠️ Fake Breakout Risk:
If price drops below $22.89 after breakout, be cautious and watch for a retest before re-entering.
🚀 Final Thoughts:
✔ Bullish Setup – If price holds above $22.89, higher targets are expected.
✔ Momentum Shift Possible – Watch for volume confirmation.
✔ Favorable Risk-Reward Ratio – 1:1.1 to TP1, 1:2.4 to TP2.
💡 Stick to the plan, manage risk, and trade smart! 🚀🏆
🔗 #StockTrading #ASAN #BreakoutTrade #TechnicalAnalysis #MarketTrends #DayTrading #ProfittoPath

Asana, Inc (ASAN) SL-$22,06 TP-$24,83Technical Analysis:
Accumulation with compression in a vertical trend
Breakout gap
Additional Note:
In a market with so many gaps, gaps are not as effective, but considering the context, I believe this is an opportunity not to be overlooked.

One of the best setups out thereLooks really good
Break of the support flipped resistance.
Volume higher today on the breakout
I will set alerts above today's highs

$ASAN Investors should monitor the companyTechnical Analysis:
Over the past month, Asana's stock has exhibited a bullish trend, with a 7.84% increase. The Relative Strength Index (RSI) is currently neutral, suggesting that the stock is neither overbought nor oversold. The Moving Average Convergence Divergence (MACD) indicator also points to a bullish momentum.
Fundamental Analysis:
Asana is a leading provider of work management software solutions. In its third-quarter report ending October 2024, the company reported a 2-cent profit per share on an adjusted basis, a significant improvement from a 4-cent loss in the same period the previous year. Revenue increased by 10% to $183.9 million, surpassing analyst expectations of $180.6 million.
In June 2024, Asana's board authorized a stock repurchase program of up to $150 million, indicating confidence in the company's valuation.
Recent News:
On February 3, 2025, Asana announced the launch of its AI Studio, aiming to enhance productivity through artificial intelligence. The company has set ambitious goals for this new product, anticipating that it could eventually surpass its current revenue base.
Conclusion:
Asana demonstrates strong technical performance and solid fundamentals, bolstered by recent product innovations and strategic initiatives. Investors should monitor the company's progress with AI Studio and its impact on future revenue growth.

$ASAN rally inbound I’m changing the process for picking tickers to make it more affordable while avoiding risky penny lots. Comment your favourite TSX tickers under $150 & NYSE or NAS under $100.
Key Stats:
• Market Cap: ~$4.88B
• Latest Quarterly Revenue: ~$260M with ~30% YoY growth
• Next Earnings Date: March 5, 2025
• Recent Analyst Sentiment: Upgraded to Buy by multiple sources
Technical Reasons for Upside:
1. Breakout Action: ASAN has recently burst above a key resistance around $22, signaling that momentum is building.
2. Trend Strength: The stock is holding strong in an ascending channel with solid volume backing – a classic setup for a run higher.
3. Momentum Indicators: A bullish MACD crossover and an RSI climbing out of oversold territory suggest the trend is shifting upward.
Fundamental Reasons for Upside:
1. Revenue Acceleration: With a robust quarterly revenue of ~$260M and a 30% YoY growth, Asana’s top line continues to impress despite its current unprofitability.
2. Customer Expansion: The company’s growing global customer base and deepening market penetration underline its potential for sustained future growth.
3. Analyst Optimism: Recent upgrades and an improving forward guidance from multiple analysts have added further conviction to the bullish case.
Potential Paths to Profit:
1. Option 1 (Low-Risk): Buy shares of ASAN at current levels and ride the momentum until the target is reached.
2. Option 2 (Moderate-Risk): Purchase LEAP call options (expiring in 6-12 months) at a strike price near the target level and sell when ASAN nears your profit target.
3. Alternative Strategy: Consider a bull call spread – buy a call option at a lower strike (e.g., $24) and sell one at a higher strike (e.g., $28) with the same expiration. This strategy can reduce upfront cost while still capitalizing on the upside.
Please LIKE, FOLLOW, SHARE, and COMMENT if you enjoy this idea! Also, share your ideas and charts in the comments section below! This is the best way to keep this signal relevant, keep the content free, and allow the idea to reach as many people as possible.
Disclaimer: We are not a brokerage or investment firm. We do not offer financial advice or investment advice and/or signals. This is not certified financial education. We offer access to the daily thought process of an individual and his experiences. We do not offer refunds. All sales are final.

ASAN Asana Options Ahead of EarningsIf you haven`t bought ASAN before the previous spike:
Now analyzing the options chain and the chart patterns of ASAN Asana prior to the earnings report this week,
I would consider purchasing the 15usd strike price Calls with
an expiration date of 2024-12-20,
for a premium of approximately $1.52.
If these options prove to be profitable prior to the earnings release, I would sell at least half of them.

ASAN - Nov 24 Opening Sustainable MomentumTrade Idea
Weak businesses that benefited from the Trump rally unravels.
Use the lack of elevated bull volume as an additional indicator of weakness
We are making a bet that at this stage of the Trump rally, it is harder to sustain buying forces for weak companies and so we will see a price reversion to the mean.
We were looking at basket of other potentials - PYCR, ASAN, PENN and FWRG. But only PYCR and ASAN looked viable after the close of the opening H2 candle. However for some reason our Stop Limit order did not activate for PYCR.
Technical entry for ASAN, is based on the momentum of the H2 opening candle.
RUT and SPX also showed bearish confluence.
Trade Planning
Volume - After Trumps win on the 6 Nov, volume was largely below the volume MA
Position - Price recently made a new high (H2)
Price - We have made new highs and are facing resistance to climb higher
Trigger
We need a momentum candle before we can enter.
Opening Sustainable Momentum 🧑🏻🚀
Strategy
Signals identify market opening H2 candles through momentum and behaviour change that potentially could indicate a shift in the current price overall structure (Price gaps and ADR %).
Risk
We use the signal candle's highs and lows for entry and stop loss. If price hits the stop loss, it is clear that the shift we expected did not come to fruitation.
Current SL is at 0.25Fib
Focus
Focus is never on the signal candle alone, but it's role in the larger structure and the direction it is inclined towards with a minimum Risk & Reward of 2R.
Stock must be in a pull back or consolidation area waiting for a broad market momentum to ignite it forward.
Character
Trend, Positive Skew

Waiting for the good entry I'd really like to see a pullback into the support zone and a re-test pf the SMA 50 at least. Perhaps also a crossover of SMA 30 and 50. Then it would be nice setup. ;)
The other option woud be to enter as soon as the price breaks the last local high. But then one got the problem that the next resistance zone is very near ...
However, just my 2 cent on this.

ASAN BULISH CORRECTIONASAN stock has shown a bullish trend recently, with an accumulation zone between $11 and $8. It's worth noting a potential distribution range between $20 and $30.

5/30/24 - $asan - temped to buy C's mkt seems offsides; risky AF5/30/24 - vrockstar - NYSE:ASAN - 3.7x sales for co growing sales ~10% pa (or that's the expectation) this year is too much esp for sub-scale software
so this is a mega high risk thing to own especially since *all?* software is getting dumped - give me a handful of names where that's not the case - and you've accounted for all of them.
so the low risk way of playing this is defn to sit it out. that's probably what i'll end up doing. however, i'd be more inclined to play a 8 DTE short situation with 50% of shares held by insiders, the quarterly bogey (and thus the next Q guide) as possibly light and a surprise to the upside. they seem to be inflecting on opex (flat) pretty nicely on the gross profit side of things.
what's the right price on this where you have a tough time losing money? 20-25 lower? is it a LT compounder? - possibly yes - given that opex flex i'm noticing, but this environment won't care b/c the factors don't really check the boxes. if i were going to play this long, it would be OTM calls of some variety. the P's skew into print gets zero'd and there's some readjustment of short cover and organic buying.
in other words, i think the market might be offsides here and while risk is high both ways - i think 50/50 into results - upside probably 20-30% move, downside 10-15% all else equal.
anyone have a more nuanced view on print/ name?

ASAN.NYSE Asana Prints a Cup & Handle Pattern.Asana has Printed a Cup & Handle Pattern which is Bullish.
The Chart Study should be self explanatory.
As always, please get a few outside Expert's Advice before making Trade or Investment Decisions.
Should you appreciate my Chart Studies, Smash That Rocket Boost Button. It's Just a Click away.
Regards Graham.

🔥HOT STOCKS: PYPL & ASANA - Like Monday.com but BETTER📉Hi Traders, Investors and Speculators of Charts📈
There are a few stocks on my immediate radar.
1) Asana - NYSE:ASAN
If you're working in a large, dynamic team you're probably using a workflow management tool like Monday.com ... or Asana.
Asana is a fantastic tool, I use it on a daily basis. It's easy to use, user-friendly and it has a wide range of easy-to-understand functionalities. BONUS - it has HUGE upside potential.
2) Paypal - NASDAQ:PYPL
Who doesn't know Paypal. PYPL has come a long way since inception, and it has improved exponentially from a user perspective experience. Paypal remains the nr1 choice for many people buying and selling online, as well as for many business. What does it have in common with Asana? - it has HUGE upside potential.
3) Alibaba - NYSE:BABA
Don't be hasty to buy just yet. Although Alibaba is still one of the biggest online retailers, Shein and Temu is starting to eat away at its market cap. For BABA, there is big upside potential but I am not convinced the price has bottomed just yet. When I spot a reliable bottom pattern, I'll accumulate a position and look for modest TP points.
4) Xiamoi - OTC:XIACF
Remember those cute little home camera's that let you watch your pet/child and even speak to them from anywhere in the world? Don't sleep on this one. AI automation, home security and... cars?
If you found this content helpful, please remember to hit like and subscribe and never miss a moment in the markets.
_______________________
📢Follow us here on TradingView for daily updates📢
👍Hit like & Follow 👍
CryptoCheck

ASAN could be a good surprise soonPotential Breakout Based on Volume and Earnings
This analysis focuses on a stock that has experienced significant volume accumulation in August 2022 and March 2023. Upcoming earnings could be a major catalyst for the stock, potentially triggering a breakout if the company reports a profit.
Volume Accumulation:
The two distinct periods of high volume suggest institutional investor interest and potential buying pressure. This could be a sign of accumulation before a potential price move.
IPO Low as Resistance:
The $20.57 level represents a significant hurdle, as it marks the lowest price the stock reached after its initial public offering. Breaking above this level could indicate a bullish reversal.
Earnings Catalyst:
The upcoming earnings report presents a crucial opportunity for the company to demonstrate its financial health and growth potential. A positive earnings surprise, particularly reporting a profit, could trigger a significant price increase.
**Disclaimer:** I am not a financial advisor and this is not financial advice. Please do your own research before making any investment decisions.

ASAN Asana Options Ahead of EarningsIf you haven`t bought ASAN prior to the previous earnings:
Then analyzing the options chain and the chart patterns of ASAN Asana prior to the earnings report this week,
I would consider purchasing the 20usd strike price Calls with
an expiration date of 2024-3-15,
for a premium of approximately $1.45.
If these options prove to be profitable prior to the earnings release, I would sell at least half of them.


ASAN - Gorgeous patternOne of the few tech names that is yet to catch on the rally, but showing signs of support in key zone.
60 VMA at 19 is critical weekly milstone. hold here could be significant pivot.
I would look for failed breakdown pattern to confirm the strength. a Red to green reversal with gap down would be a great sign.

ASANA Stock Chart Fibonacci Analysis 121623 Trading idea - Entry point > 21/61.80%
1) Find a FIBO slingshot
2) Check FIBO 61.80% level
3) Entry Point > 21/61.80%
Chart time frame : C
A) 15 min(1W-3M)
B) 1 hr(3M-6M)
C) 4 hr(6M-1year)
D) 1 day(1-3years)
Stock progress : B
A) Keep rising over 61.80% resistance
B) 61.80% resistance
C) Hit the bottom
D) Hit the top
Stocks rise as they rise from support and fall from resistance. Our goal is to find a low support point and enter. It can be referred to as buying at the pullback point. The pullback point can be found with a Fibonacci extension of 61.80%. This is a step to find entry level. 1) Find a triangle (Fibonacci Speed Fan Line) that connects the high (resistance) and low (support) points of the stock in progress, where it is continuously expressed as a Slingshot, 2) and create a Fibonacci extension level for the first rising wave from the start point of slingshot pattern.
When the current price goes over 61.80% level , that can be a good entry point, especially if the SMA 100 and 200 curves are gathered together at 61.80%, it is a very good entry point.
As a great help, tradingview provide these Fibonacci speed fan lines and extension levels with ease. So if you use the Fibonacci fan line, the extension level, and the SMA 100/200 curve well, you can find an entry point for the stock market. At least you have to enter at this low point to avoid trading failure, and if you are skilled at entering this low point, with fibonacci6180 technique, your reading skill to chart will be greatly improved.
If you want to do day trading, please set the time frame to 5 minutes or 15 minutes, and you will see many of the low point of rising stocks.
If want to prefer long term range trading, you can set the time frame to 1 hr or 1 day.

ASAN Asana Options Ahead of EarningsIf you haven`t bought the dip on ASAN:
Then Analyzing the options chain and the chart patterns of ASAN Asana prior to the earnings report this week,
I would consider purchasing the 22.50usd strike price at the money Calls with
an expiration date of 2023-12-8,
for a premium of approximately $1.65.
If these options prove to be profitable prior to the earnings release, I would sell at least half of them.
Looking forward to read your opinion about it.

ASAN Asana Options Ahead of EarningsAfter the success of the past 2 earnings calls:
and
Now analyzing the options chain and the chart patterns of ASAN Asana prior to the earnings report this week,
I would consider purchasing the 25usd strike price Calls with
an expiration date of 2023-11-17,
for a premium of approximately $1.42.
If these options prove to be profitable prior to the earnings release, I would sell at least half of them.
Looking forward to read your opinion about it.

ASAN Asana Options Ahead of EarningsIf you haven`t bought ASAN here:
then Analyzing the options chain of ASAN Asana prior to the earnings report this week,
I would consider purchasing the $22.5 strike price Calls with
an expiration date of 2023-8-18,
for a premium of approximately $2.42
If these options prove to be profitable prior to the earnings release, I would sell at least half of them.
Looking forward to read your opinion about it.
