ATI trade ideas

ATI daily chartWatch ATI on daily. Holds the support line, ready to breakout - daily candle closed above VWAP.
1st target 20.5, 2nd target is 23

ATI bullish harami and bullish hammer near support zoneWeekly analysis:
1) Huge red candles with huge volumes. Stock may be tired at this point and may reverse
2) MACD , RSI and FI all traced lower low when the price is at the same low as before
Daily analysis:
1) Bullish harami and bullish hammer candle with huge volume near support zone
Intraday analysis:
1) Climatic ending selling volume followed by huge buyer volume

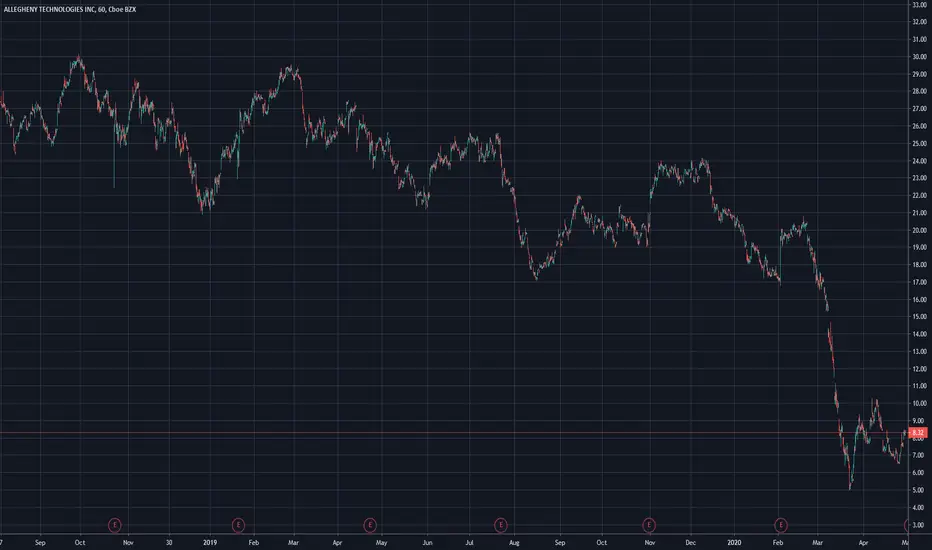
$ATI early week earnings watch, strong historical mover$ATI shares nearing a key resistance breakout and will report early this week, higher 8 of last 9 reports with an average 9.6% max earnings day move, and has some notable call open interest in July, Jan 2020 and Jan 2021


Big Volume increase, consolidation This is from a scan I created on Think or Swim, looking for potential breakouts. It has been consolidating for at least the past 4 hours and is above the midline of the Bollinger Band.


27.85 is tomorrows High. Mark my wordsI'm stil hold my short postions and put option contracts. This is a money maker if youre not already in it.

NEN STAR! Short the hell out of herI've opened 27.50 PUT option as well as shorting the stock @ Market Open
Watch for price to possibly reverse at 26.50

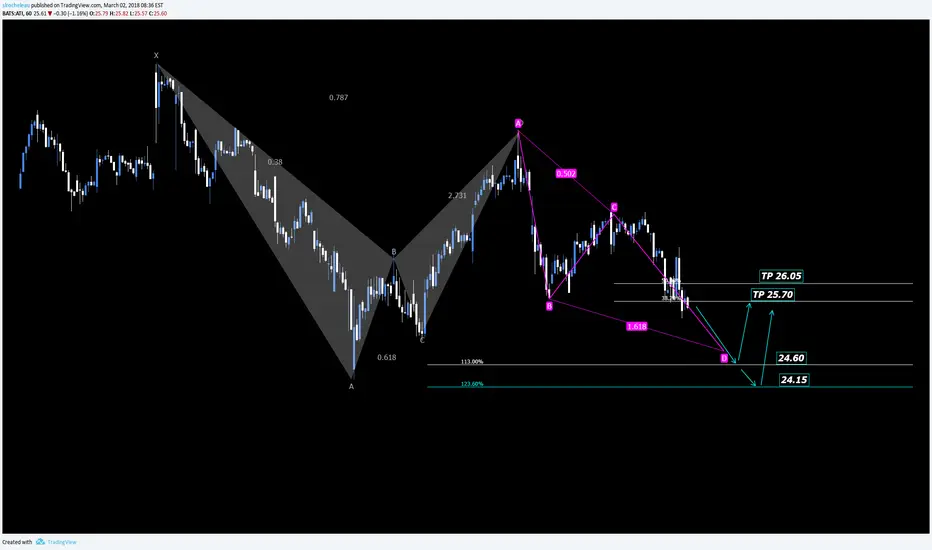
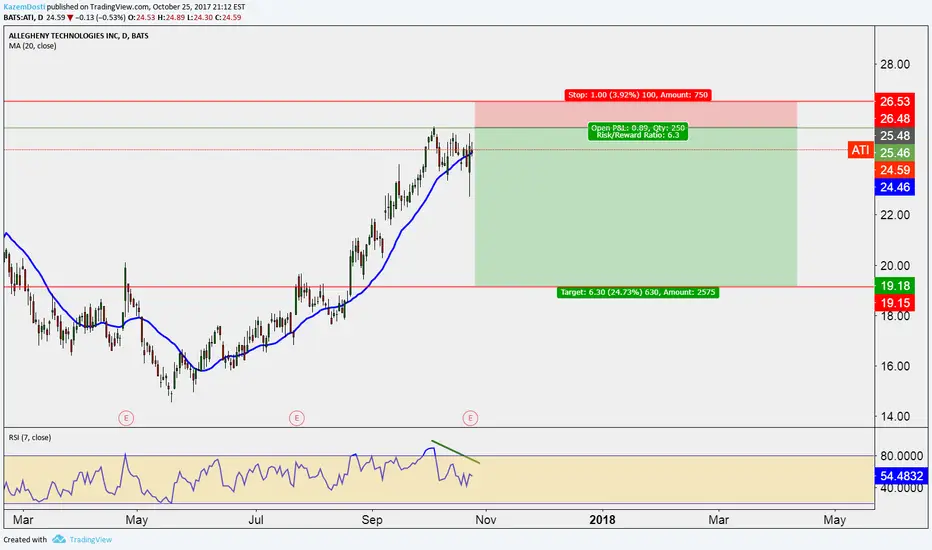
Watch Price Action at the 24.60-24.15 rangeI'm waiting to buy in in the $24.00 Range and take some profits aroun 25.50.
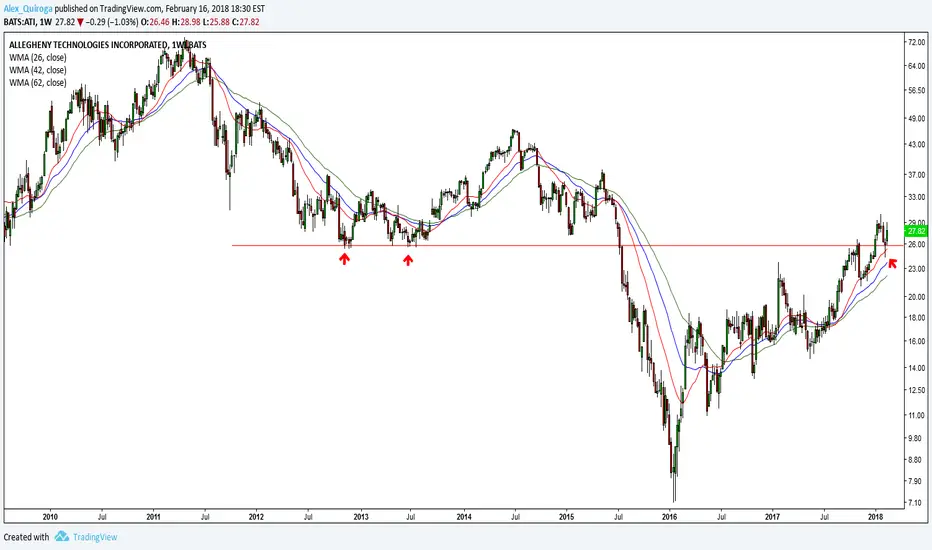
Survivor of the biggest point drop In History #8 (ATI)In the last publications I am reducing the quantity of words that I use because I follow a large number of companies and when I identify a pattern, I do not use a lot of technical terms in my head only a few lines and pay attention to the whole picture, look the candlesticks (but not signal candles with names) and always make a multiple time frame analysis from weekly to daily. Because these ideas are for swing traders and even position traders if the price allow
here I just have to point out a couple of things
The main is the past support line around 25.80 look in 2012 and 2013 red arrows. And now the price is above that level with property.
And now in today times look the pullback to the line and the lower shadow of the past weekly candle and in this week there are a swing low in progress (The green candle)
This Ideas are for price action swing traders
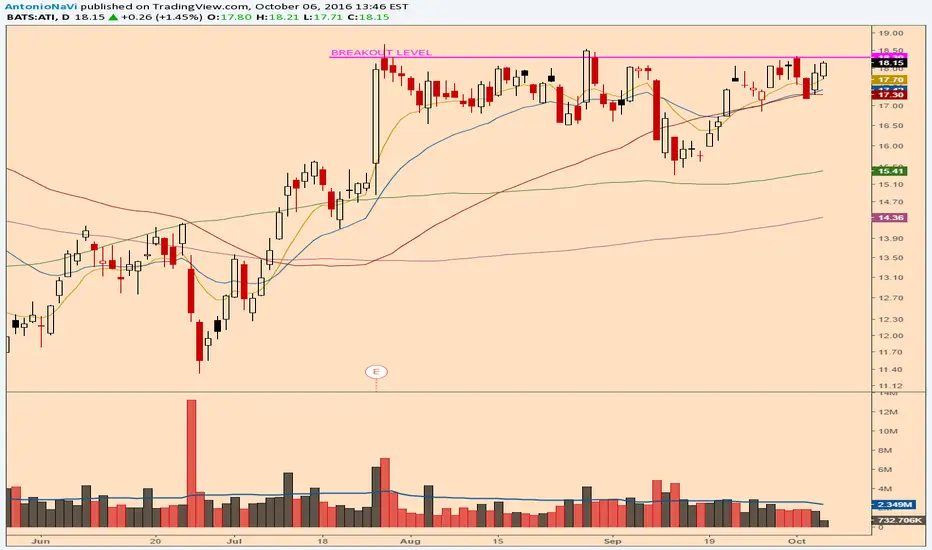
ALLEGHENY entering a new bullish phaseAllegheny has recently confirmed its "cup and handle" pattern. The pattern is very clean, the breakout is strong, the pullback occured, all elements are present for a bullish rallye. I BUY => target: +47%

Technicals for ATI weekly. $28 is a critical area to watch.a break above $28 my long targets will be 34.18, 45.70 and 66.65
Rejection at $28 my short targets will be 21.70, 18,70 and 15.32
Bearish RSI Divergence at the top of the channel so watch it if your holding


ATI - BullishATI is looking bullish on the daily chart, as the MACD has crossed over on higher bullish volume, as of 5/19/217. Based the chart pattern, it looks ATI is attempting to break through the .236 FibR on higher volume, this is the second day with a close above the 9dma.
Would like to see more bullish volume to take it the .382 FibR at $17.69 for a 5% gain. Although the pattern is a bearish pennant (4/25 to 5/18 to present), ATI seems to be knocking on the roof to break through.

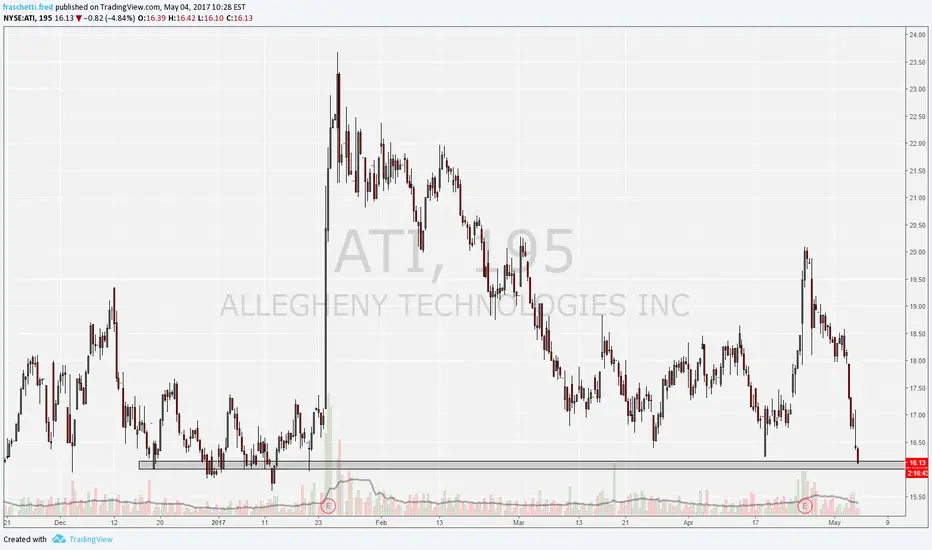
ATI at historial supportthey beat earnings last 2 reports. good time to take a position , i think
ff
what you all think