ATI: Allegheny Technologies, Weakness At Fibonacci .382Allegheny Technologies Incorporated is one of the largest and most diversified producers of specialty materials in the world. The company's talented people use innovative technologies to offer growing global markets a wide range of specialty materials including stainless steel, nickel-based and cobalt-based alloys and superalloys, titanium and titanium alloys, specialty steel alloys, zirconium and related alloys, and tungsten-based specialty materials.
It is a component of-XME.
XME-has been weak for the past month.
I suspect the basic metals components in-XME (iron-copper-steel-zinc-aluminum) are weaker than the gold-and-silver miners.
For-ATI:
The indicator on the top of the page is RSI / Stochastic , and this is weak.
The top middle indicator is vortex and it is weak (red over green developing).
The Top (bar-type) indicator measures the "phase energy" of the stock , and this is weakening. It was much higher in March when the failure happened at Fib .382.
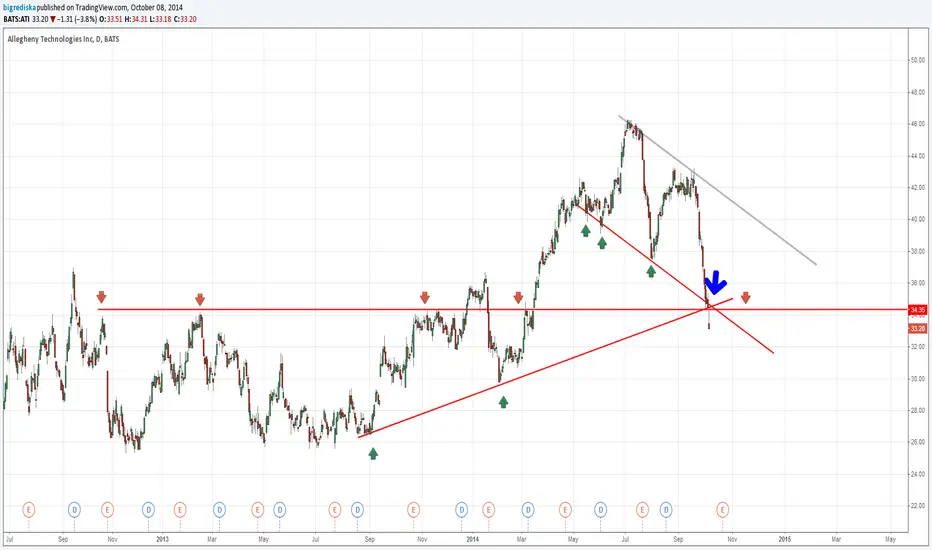
Until these indicators reverse to the upside, and the prices rise above Fibonacci .382, this stock is a sell .
Good luck to you. Don.
ATI trade ideas

ATI finding support at the bottom of an uptrending channelAfter experiencing a significant pullback ATI has fallen in volatility.
ATI is now finding holding itself at a well validated support line within an uptrending channel.
The MACD and signal lines are also entwining around one another at a level which corresponded at the previous structure lows.
Out of the potentially bullish outcomes, the price may experience resistance at previous structure highs or it may continue upward towers the top of the uptrending channel line as indicated with the arrows.
These price targets represent 3:1 or 4:1 R:R trades respectively.
DYOR as always.

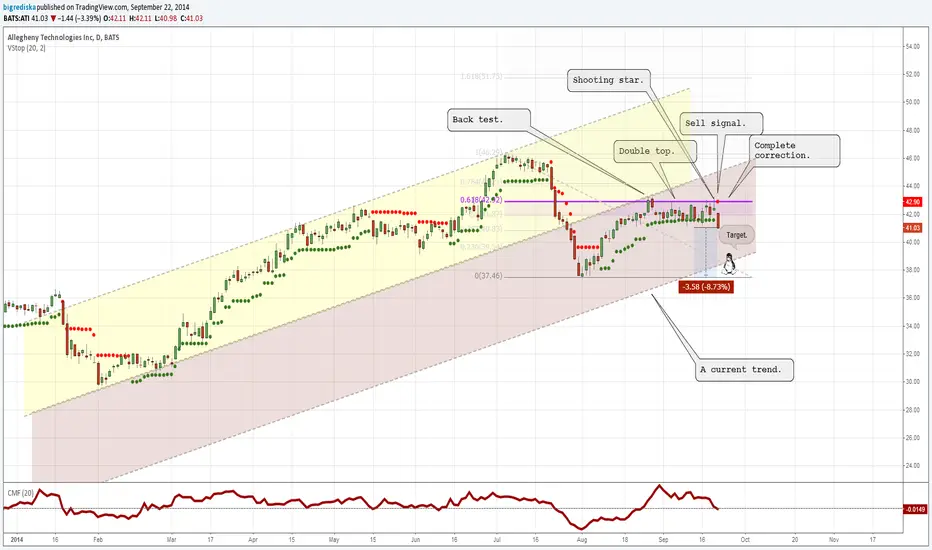
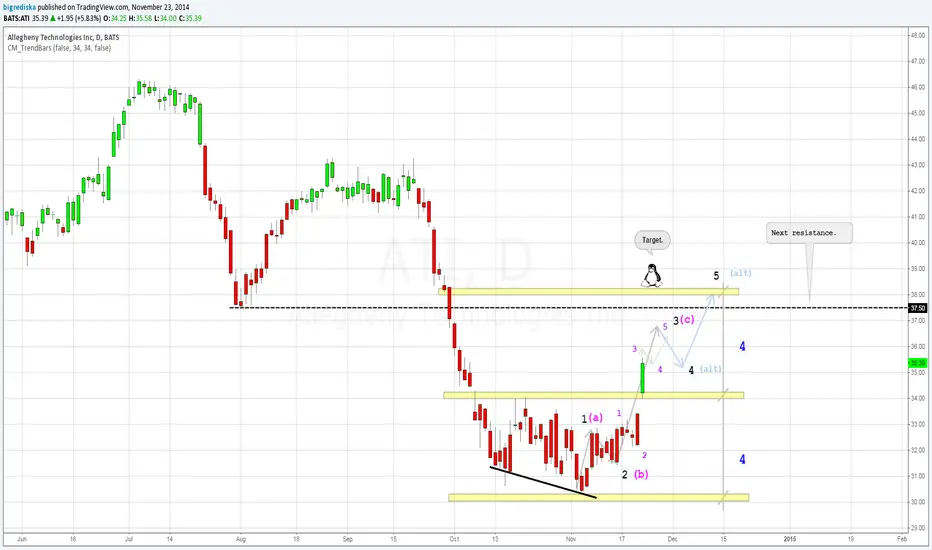
I expect the continuation of the corrective wave C.I expect the continuation of the corrective wave C.

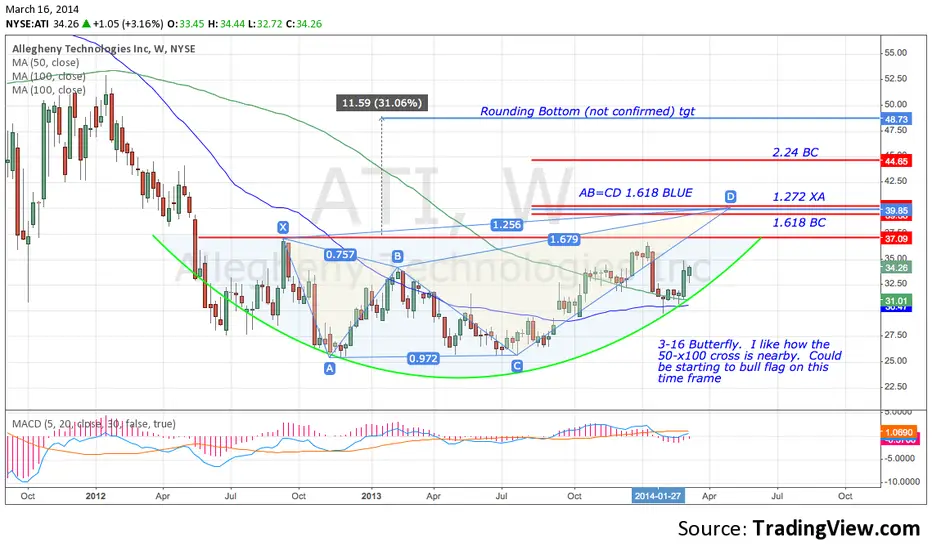
ATI daily bullish mode detachment 22 day balance period has detached on high participation in search of new value.. Move could be swift to $40 as no relevant resistance seems to be in the way before then.

ATI offers significant potential for those positioned correctly Mode building still in process.. I would wait for a new extreme outside the current range to avoid whipsaws


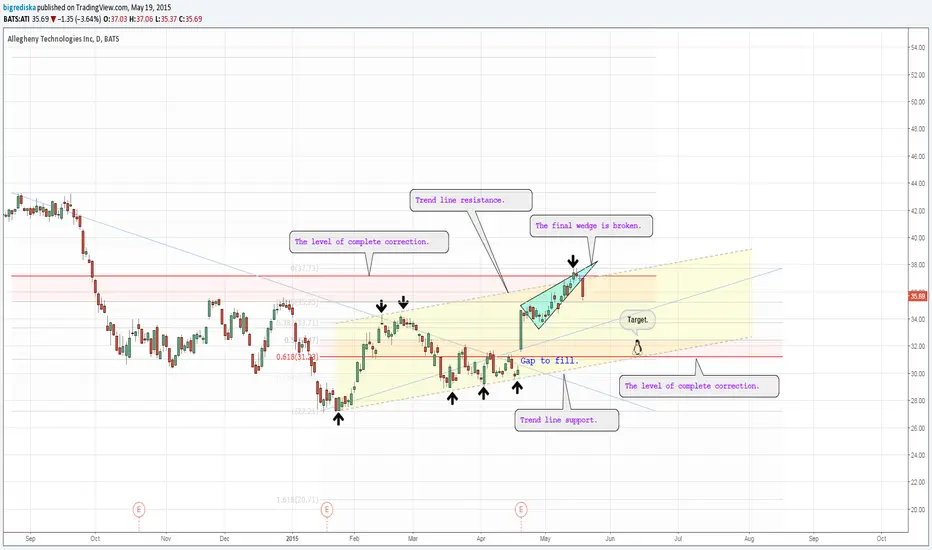
I'm not sure that the fall will continue.But I know where to put the stop. When the stop is so close...It's always a good opportunity to open a position.