Altice USA, Inc to print disturbing gains of 500% ??** For the active investor — weeks and months ahead **
On the above 10 day chart price action has corrected 95% from $38 to $1.65 without the aid of stock splits. A number of reasons now exist to enter a long position. They include:
1) Price action and RSI resistance breakouts.
2) Support on past resistance confirms.
3) Regular bullish divergence. Multiple oscillators print positive divergence with price action over a 3 month period.
4) No stock splits!
5) 10% short interest.After 95% correction, good luck with that.
Is it possible price action continues to correct? Sure.
Is it probable? No.
Ww
Type: Investment
Risk: You decide, please do you’re own due diligence
Timeframe for long: This year.
Return: 400-500%, no significant resistance until $12
Stop loss: elsewhere
ATUS trade ideas

ATUS 1DThis asset recently broke above the 200 EMA and is consolidating in and descending triangle with healthy RSI readings. Watch out for bullish or bearish breakout. We need another miracle. If you can check out @without_worries TA on this asset.

ATUSa nice long trade opp.
from oversold level - chart showing incoming strength.
a move to $20 - 22 is likely possible.
SL - dec. lows...

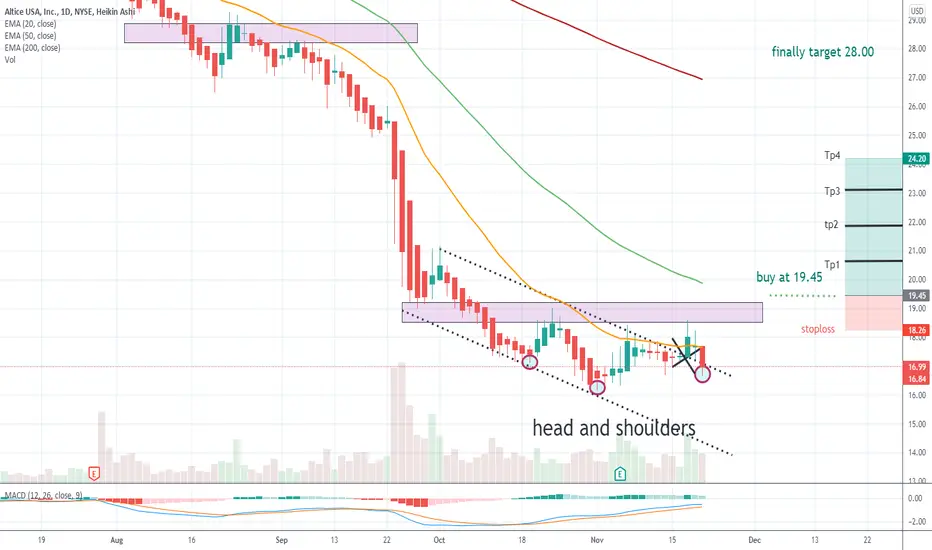
atus buywe have head and shoulders with broken channel ..buy at 19.45 ..first target 24.20 .. finally target 28.00 stoploss18.26

ATUS LongTrendline break
Demand Zone confirmation (3/17/2021 drop based rally)
Entry 18.2
Stop 16
Target 25
Risk management is much more important than a good entry point.
I am not a PRO trader.
In my trading plan, the Max Risk of each short term trade should be less than 1% of an account.


ATUS pushing the extremesNYSE:ATUS pushing the extremes of the 99.9% probability cone. Bids filled at $17.55.
Probability Cone is based on the Expected Move. While Expected Move only shows the historical value band on every bar, probability panel extend the period in the future and plot a cone or curve shape of the probable range. It plots the range from bar 1 all the way to bar 31.
In this model, we assume asset price follows a log-normal distribution and the log return follows a normal distribution.
Note: Normal distribution is just an assumption; it's not the real distribution of return.
The area of probability range is based on an inverse normal cumulative distribution function. The inverse cumulative distribution gives the range of price for given input probability. People can adjust the range by adjusting the input probability in the settings. The probability of the entered standard deviation will be shown in the middle when the "show probability" setting is on.

Altice (ATUS) - Approaching An Interesting Buy ZoneHere's a deeper dive into my own trading plan for ATUS. Risk management is key here and I'm opting for the tighter stop loss for the bulk of my trade.

ATUS oversold! Price target and stop lossAltice USA, Inc. (ATUS) oversold on the daily!
Based on support and resistance we have:
Price target: 28.90usd
Stop loss: 18.50usd


Long ATUS. I've made worse arguments.Looks like it's reversing to me.
I have been reading a lot about trend reversals lately... so take that information for what it is.
To me, it looks like its got major profit potential.... as do all trend reversals pre-maturity...

ATUS - UPDATE - Previously false breakout - PT - $38In previous chart published, it showed false breakout due to ER big sell off trapping a lot of bulls. This stock has been tough to crack.
Now it has closed the gap. Will it breakout of the upper trend line this time for real?
Price target - 38
Stop loss - 32.82.
———————————————————
How to read my charts?
- Matching color trend lines shows the pattern. Sometimes a chart can have multiple patterns. Each pattern will have matching color trend lines.
- The yellow horizontal lines shows support and resistance areas.
- Fib lines also shows support and resistance areas.
- The dotted white lines shows price projection for breakout or breakdown target.
Disclaimer: Do your own DD. Not an investment advice.


ATUS Hits Support, Be Ready for BounceAltice USA shares briefly broke support and now it is pushing back up through it. In the past, when it has tested this support, it has bounced back up. In addition, the MACD and RSI indicators also look extremely bullish. I think this stock is pretty much a 10% guarantee. Target sell $38. Good Luck!

ATUS - Break out $40 reiteratedBreak out $40 reiterated.
———————————————————
How to read my charts?
- Matching color trend lines shows the pattern. Sometimes a chart can have multiple patterns. Each pattern will have matching color trend lines.
- The yellow horizontal lines shows support and resistance areas.
- Fib lines also shows support and resistance areas.
- The dotted white lines shows price projection for breakout or breakdown target.

ATUS - Breakout target $40Breakout target $40.
———————————————————
How to read my charts?
- Matching color trend lines shows the pattern. Sometimes a chart can have multiple patterns. Each pattern will have matching color trend lines.
- The yellow horizontal lines shows support and resistance areas.
- Fib lines also shows support and resistance areas.
- The dotted white lines shows price projection for breakout or breakdown target.


$ATUS handle providing a great entry-point. Strong LONG on this!Looking for a breakout here. Sell-point 40+; Will become clearer later.
Cup and handle formation on the chart; it could breakout tomorrow or late today.
More details as this unfolds, but a position has been taken, and the average cost seems pretty nice.
-BEST N SHYT!
-BDR

ATUS - Monthly ATH breakout sleeper pickHaven't played this ticker before, but it looks like a solid risk/reward play with decent OI/Volume on 12/18 contracts.
Potential Contracts:
12/18 35c
12/18 36c
ATH breakout play.
The entry trigger is the yellow line above ($35.40).
Looks like this one really wants to pop off.


$ATUS Bearish Trade PlanGreen Line - Entry Target
Red Line - Exit Target
Pink Line - Stop-Loss
Highly suggest using Google to Search "Transparent Traders" if you're trying to get to the next level.
Transparent Traders exists to solve the critical issues facing our traders, both large and small. Our unique approach is not only what differentiates us, but also what makes us successful.
Our advanced Blackbox uses custom algorithms & predictive A.I. to locate the most accurate day or swing trades for the best chance of success.

ALTICE USA Title DailyHey people, ALTICE USA is in a fake downtrend with stable purchase volume made and a shadow bear. The TIMEFRAME 1 Min we can see a bullish continuation Strong potential to go to the last precedent higher if the buyers are still in the process. See TIMEFRAME 4H, not enough force to climb higher.
Please LIKE & FOLLOW, thank you!!
