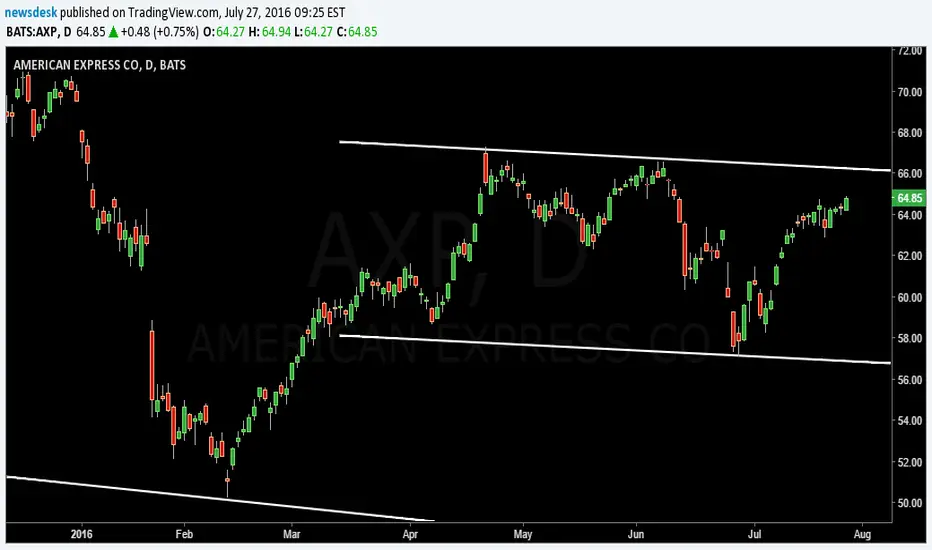
AMERICAN EXPRESS with conservative SetUp68.10 Yearly High 2016 @ 1st Trading Day this Year
64.04 100 SMA
62.69 200 SMA
62.33 low after break out of trading box
61.25 gap - while the sell off @ start of the year
58.85 gap - while the sell off @ start of the year
buying trading capability above the trading range (58.85 & 61.25)
- the lows in may and june/july supported the upside (even above 62.33) too.
Take care
& analyzed it again
- it`s always your choice ...
Best regards
4XSetUps
AXP trade ideas

AMERICAN EXPRESS @ 15 min. @ this week, next week into ChristmasBreakOut yeasterday - earlier as excepted ...
I personally thought the market will breath out before ECM Mario today & FOMC Yellen next week and rise after both meetings into christmas - even into year end 2016. How ever, Independently of the central bank decissions it seems that the technical outbreak has been successful ...
74.18 - 73.05 AXP grey box (price zone incl. next week - above last OuBreak)
73.05 - 72.65 AXP green box (superordinate price zone - after last OutBreak)
72.67 - 71.18 AXP yellow box (actuallity price zone this week - under last OutBreak)
Don`t jumpt behind the prices, like a missed bus.
We`ll see prices between 73 & 74 AXP surely next week.
And from this point of view, even based on this conclusions, i am still prefering the long side.
But even conservative - contrarian buying opportubnities - cause the fundamentals are strong also.
And this means, at least my opinion, buying the dips into christmas and year end. `Cause the high of 2016 was by 68.11 AXP and this was the 1st price 2016 - even opening price`16. All in all around 10% in 2016 should not make the market euphoric - like the whole financial and banking sector. `Cause we, all market particpants (traders, watchers, analysts, etc. etc.) have the so called crises since 2008 still not surpassed. At least price technically - even far away from new highs like JPM Morgan for example ...
Take care
& analyzed it again
- it`s always your decission ...
(for a bigger picture zoom the chart)
Best regards
Aaron

Is AXP being sent to the Chop Shop?Weakness in Visa and Mastercard is telling me that it is more likely that AXP will follow the group rather than the group following AXP. If you are long this may be a good place to go flat or reduce position size until we see if this plays out. This doesn't look like a candidate to go short on, at least not yet.


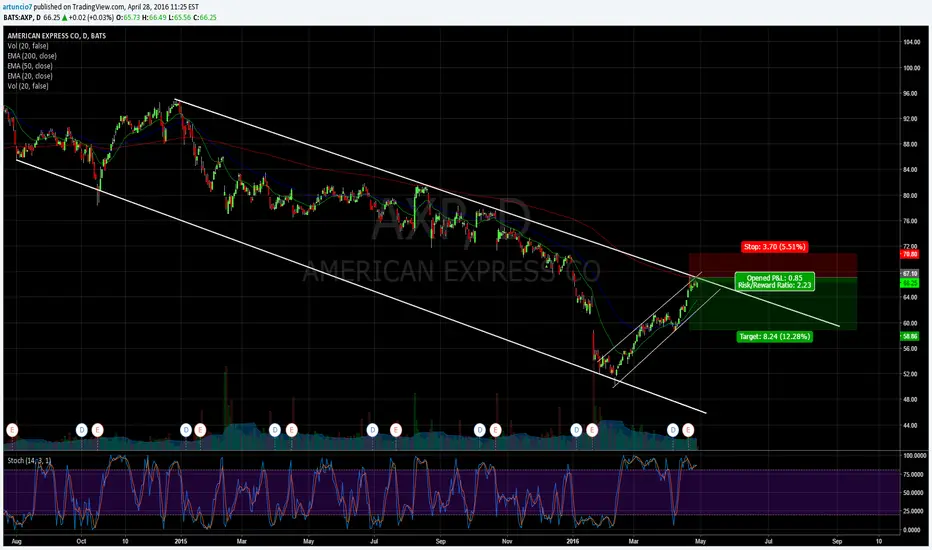
AXP: Triggered a bi-weekly uptrend after earningsAXP has a very interesting setup here, and it appears it can rally strongly over $80 from here.
The setup is a bi-weekly 'Time at mode' uptrend, so we can enter longs at market risking a reasonable $4.59 per share, for a total of position of 3.5%-7% of your capital (no need for a stop loss).
Good luck!
Ivan Labrie.


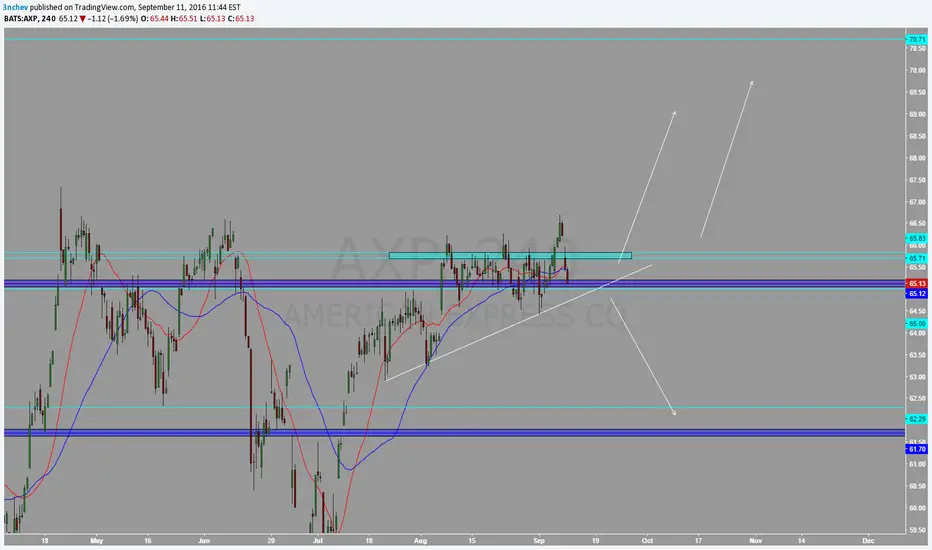
AMERICAN EXPRESS @ 30 min. Chart @ Outbreak still shiftedactuallity basic downside trendline
66.71 (08.09.16) start of the actuallity downside trendline
66.09 (12.09.16) end of the actuallity downside trendline
63.90 (23.09.16) where the extended trendline was on last trading day
63.85 (23.09.16) Friday (last trading) Closed
66.09 (12.09.16) based on actuallity downside trendline (end of the actuallity down side trendline)
64.13 (05.08.16) based on actuallity downside trendline (1st low of trading range in an higher broader trading zone)
65.08 (22.09.16) 1st target after false breakOUT of the actuallity downside trendline
trading range in an higher broader trading zone
66.28 (23.08.16) 3rd high of trading range in an higher broader trading zone
66.25 (08.08.16) 2nd high of trading range in an higher broader trading zone
66.09 (12.09.16) 1st high of trading range in an higher broader trading zone
64.13 (05.08.16) 1st low of trading range in an higher broader trading zone
64.41 (16.08.16) 3rd low of trading range in an higher broader trading zone
64.52 (08.08.16) 2nd low of trading range in an higher broader trading zone
64.57 (09.09.16) 4th low of trading range in an higher broader trading zone
63.85 (23.09.16) Friday (last trading) Closed
higher broader trading zone
66.70 (08.09.16) 3rd high of the higher broader trading zone
67.33 (21.04.16) 1st high of the higher broader trading zone
66.58 (07.06.16) 2nd high of the higher broader trading zone
63.85 (23.09.16) Friday (last trading) Closed
63.16 (16.09.16) 3rd low of the higher broader trading zone
63.18 (02.08.16) 2nd low of the higher broader trading zone
62.88 (21.07.16) 1st low of the higher broader trading zone
high of the higher broader trading zone
63.96 (23.09.16) 100 Daily SMA
63.85 (23.09.16) Friday (last trading) Closed
63.41 (18.08.16) Golden Cross BUYING Signal
62.51 (23.09.16) 200 Daily SMA
63.38 (20.06.16) high before BreakDOWN & trend-reversal-formation
63.27 (23.06.16) high before BreakDOWN & trend-reversal-formation
62.30 (19.05.16) low before a trend-reversal-formation was created (while june & july)
Take care
& analyzed it again
- it`s always your choice ...
Best regards
4XSetUps


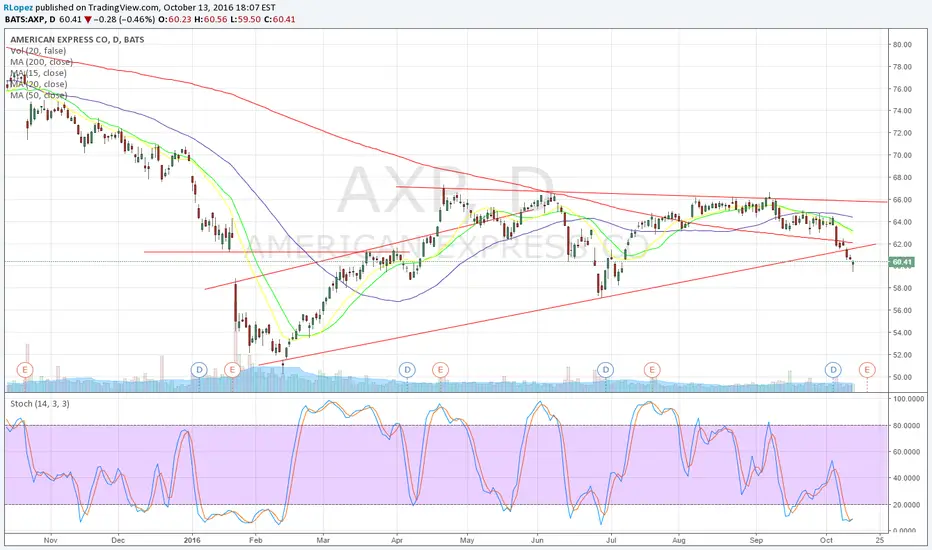
Watching but could be a good entry Price action has been consolidating for AXP shares since the triple top from 2014-2015.Since then the price bottomed out around 50 before heading back up to resistance at 66.5. I am watching for a strong break upwards through resistance with heavy volume before entering trade. However if this occurs it would indicate that upward trend is back and intact for AXP, a great dividend stock and a Buffett favorite.

AXP - still showing strength.I was closely watching AXP after it was previously rejected at the 200 MA, however the drop didn`t really go far and it seems as if strong hands are still supporting further gains. Look for this gap close around 66.42 USD & then possibly still further upside.
P.S. Congratulations to all followers who participated in BABA after my call-out :-)


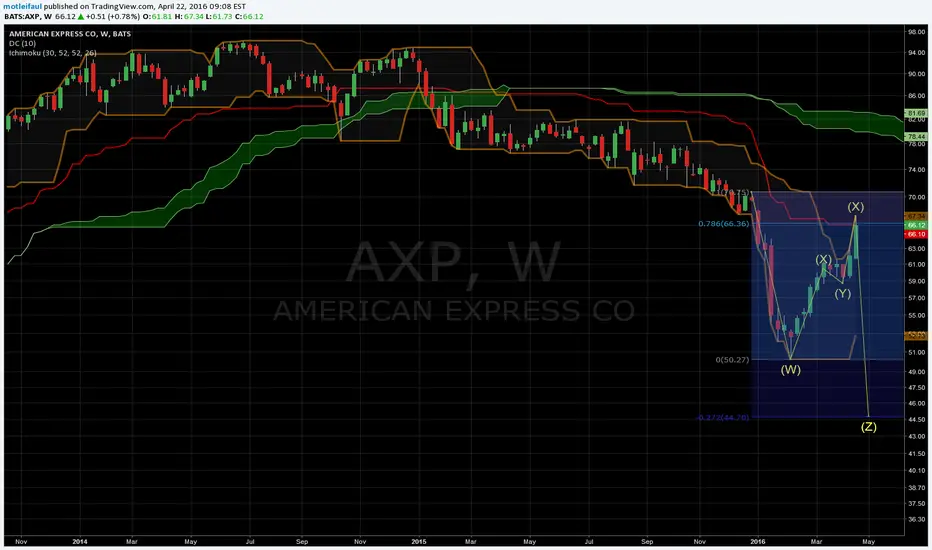
American Express The weekly chart looks pretty interesting to watch for a move from Friday’s close that would be 14.07%. Keep in mind that this stock took a hit within 3 months. American Express is trying to make it back up above $74.76. I think that American Express will recover with 51 days when earnings reporting. The month started off in green a little resistance within the triangle. I think $80 is a good buy.