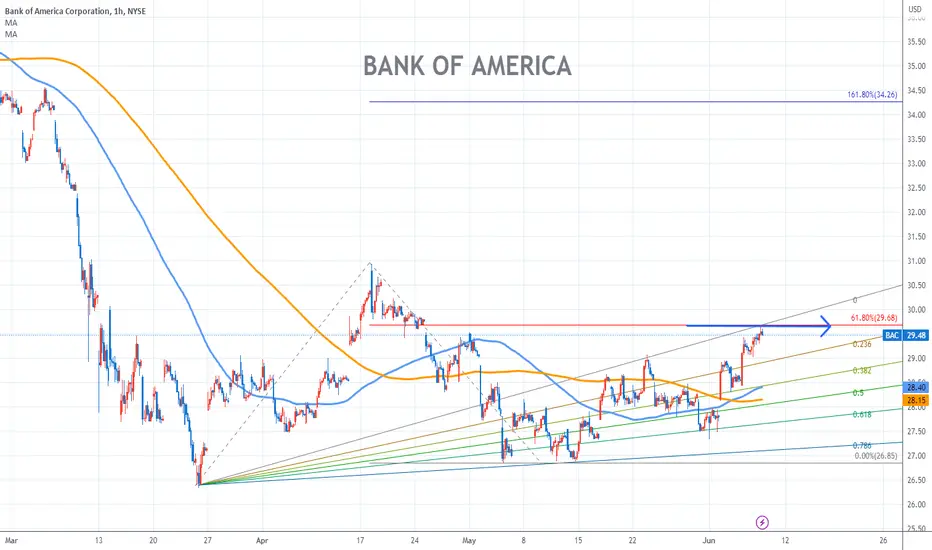
BANK OF AMERICA Stock Chart Fibonacci Analysis 060723 Trading Idea
1) Find a FIBO slingshot
2) Check FIBO 61.80% level
3) Entry Point > 29.6/61.80%
Chart time frame : B
A) 15 min(1W-3M)
B) 1 hr(3M-6M)
C) 4 hr(6M-1year)
D) 1 day(1-3years)
Stock progress : B
A) Keep rising over 61.80% resistance
B) 61.80% resistance
C) Hit the bottom
D) Hit the top
Stocks rise as they rise from support and fall from resistance. Our goal is to find a low support point and enter. It can be referred to as buying at the pullback point. The pullback point can be found with a Fibonacci extension of 61.80%. This is a step to find entry level. 1) Find a triangle (Fibonacci Speed Fan Line) that connects the high (resistance) and low (support) points of the stock in progress, where it is continuously expressed as a Slingshot, 2) and create a Fibonacci extension level for the first rising wave from the start point of slingshot pattern.
When the current price goes over 61.80% level , that can be a good entry point, especially if the SMA 100 and 200 curves are gathered together at 61.80%, it is a very good entry point.
As a great help, tradingview provide these Fibonacci speed fan lines and extension levels with ease. So if you use the Fibonacci fan line, the extension level, and the SMA 100/200 curve well, you can find an entry point for the stock market. At least you have to enter at this low point to avoid trading failure, and if you are skilled at entering this low point, with fibonacci6180 technique, your reading skill to chart will be greatly improved.
If you want to do day trading, please set the time frame to 5 minutes or 15 minutes, and you will see many of the low point of rising stocks.
If want to prefer long term range trading, you can set the time frame to 1 hr or 1 day.
Bank of America Corporation Depositary shares, each representing 1/1,000th interest in a share of 4.375% Non-Cumulative Preferred Stock, Series NN
No trades
BAC/PO trade ideas
BAC rising from support LONGBAC on the daily recently descended from an asymmetrical head and shoulders pattern
near to or in the supply zone as indicated by the Luxalgo indicator down into the demand
zone in late March and early May for a double bottom. Fundamentally, the banking system
has been propped up by the federal central banking mechanisms and the situation seems to
have stabilized. DPST and KRE banking ETFs have had some good days of late. On the chart
the Luxalgo Echo indicator, a predictive algorithmic tool, suggests that BAC will rise during this
summer and then bounced down from the resistance of the trendline of the neck of the
asymmetrical H & S. I can easily conclude that BAC is ripe for a long trade. I will take
an out of the money call option for DTE 9/20 striking #37.00. I will set the stop loss at
20% - Of the 15 contracts, I will close 2 after each 20% profit level is achieved and expect
to make overall 150-250% by mid-August. Because of time decay, I will not carry these
open beyond September 1st.

BACMake triangle chart pattern in 4 hour time fram , take break out with High volume MACD and RSI saw fair value , also check in multiple time frame so first Target will be 33.26 and Stop loss will be 27.01
This is for educational purpose not a trading advice so that's my view comment down your view 🤗

How to Trade Three Inside Up PatternsHow to trade three inside up patterns with entries and stop levels.

BAC,10d+/28.95%rising cycle 28.95% more than 10 days.
==================================================================================
This data is analyzed by robots. Analyze historical trends based on The Adam Theory of Markets (20 moving averages/60 moving averages/120 moving averages/240 moving averages) and estimate the trend in the next 10 days. The white line is the robot's expected price, and the upper and lower horizontal line stop loss and stop profit prices have no financial basis. The results are for reference only.

$BAC heading North from bottom of the tri (?) FWB:BACT - not the strongest close on the 2D, but I'm keeping an eye on this one.
Potential move back up from the bottom of the tri on the 2W (a.k.a. broadening formation).
Keeping in mind BAC is still one of the weaker brothers in the XLF...let's get back to that later, still work in progress (study sector ETF's vs individual names).

Trend analysis with Harmonic Bat patternAccording to my analysis, I can see after the down trend complete, the re-correction start with zigzag wave and also the Harmonic Bat pattern gonna be complete after re-correction.
The TP gonna be in the end of Bat expected target.

Next move of BACAs you can see in the chart NYSE:BAC Had started A massive uptrend in the last 11 years that It's almost over by my point of view.
Sl of this Analyze is 35$. In the second blue zone we can risk free our position by your own Strategy.

BAC - Possible setup.Breakout of Falling trend line, and possible double bottom pattern. Buy above 28.70.

Bank stocks about to get obliteratedWave count, put-call sentiment, SKEW, VIX, and GANN timing all suggest that bank stocks (and likely the entire stock market) are about to get obliterated. GL.

Pattern with in the Pattern BAC Head and ShouldersTrying too hard on this one? Most likely. Seeing the biggest banks/financials/Transports, on the planet. JPM, GS,WFC, C, BAC, IYT, VTHR having head and shoulders patterns

Bank of America - Start of Wave C?? Bank of America seems of have broken a bearish wedge pattern of 10 years. If this holds, this could be the start of the mother of all crashes....

$BAC - Will it fill the gap or do double bottom Came close to the gap it left behind in 2021. It could become a double bottom trade. 👀ing. What do you think? Fill the gap or do double bottom.

BAC checking to see Checking to see if there is a descending triangle pattern going on with Bank of America. I will be checking up on this everyday and for the next few weeks. NYSE:BAC #BAC

The END is NEARNow I understand there are a lot of shenanigan's going on in the banking sector, but I'm not going to pretend to know how exactly this will affect the price of bank stocks. Everyone and their mom is now bearish on bank stocks from the constant news of bank failures and if I've learned anything from the markets is that the market always moves against the crowd. So I make my decisions strictly from the price action and volume obtained from charts.
BAC has been trending on this blue support line since 2016.
You can even take it back to 2011. Each time it has bounced off of this blue trend line. However this time, it will be different. This time we had an inverse head and shoulder from which price broke down with SIGNIFICANT volume
Although the price has bounced from the blue trend line for right now, it has already rejected the previous support of the inverse head and shoulders at $30. Validating the breakdown with more downside to come. The fact that a bearish pattern broke down with such high volume right above the extremely strong blue trend line tells me price action is gathering strength to be able to break below this blue trend line after years of support. When this break below occurs, it will be nasty. A rapid fall in price, not slow and drawn out. An optimistic bounce area will be between 24 to 23. However, a break of a trend line this strong can only be accomplished with significant strength, in this case bearish strength. I see BAC falling to the 19.5 to 17.5 dollar range, an area that previously was a resistance but is now a support. When will this break down happen? I don't know, but price action is showing it is bound to happen in the upcoming future. Possibly after earnings are all done with.

Bank of America in Down-trend now #NYSEHere you can see that Bank Of America is trading in a down-trend now days and moving towards the strong support line which comes from past and already Market had test this support line two times in 2016 & 2020 respectively. Now if BAC broke 26.32USD then we can take a trade for a further downside with the target of 23.50USD .

BANK OF AMERICA HEAD N SHOULDER TOP The chart posted is that of BAC we had what seems to be a rather classic head n shoulder top so if the over all market is going to hell as I stated in the forecast dec 2021 why does everyone WANT and Need to trade the long side ??? I have lived thru NINE BEAR MARKETS and have traded since 1972 when I was in high school. I have managed funds since 1990 .So if you all seem the need to be compulsive to trade . it sound like a few of you Think you are going to MISS OUT . Relax !! To make $$$ you may miss alot of trades but there is always another day !! I told you the FED is going to reduce the balance sheet if they are to keep the Credibility inflation must break 3.2/3.6 core by year end. Best of trades WAVETIMER


BAC Bank of America SHORTBAC is shown here on the 15 minute chart. Fundamentally, it is under pressure like
many other banks including First Republic.
On the chart, price is in a downtrend having bounced from VWAP (redline)
in confluence with the blue line of the top of the high volume area of the
volume profile. Price is underneath the blackline which is the 210 HMA.
Only shorts should be taken underneath that line.
The target is the thin red line below which is the bottom of the low volume area.
Accordingly, the thin red line is the target while the thin blue line or the
VWAP (thick red) are the stop loss levels. This is a very safe trade with
an acceptable R:R.
My put option @ $ 28.50 for expiration 5/12 gained 68% overnight.
I will ride this down and then look for the reversal trade.

Multiple indicators continue to support the BTC market.BINANCE:BTCUSD
Fundamental Analysis:
The third major financial event of May is coming up, the interest rate meeting and the non-farm payrolls data.
All financial market investors are watching for the speech at the May 2 meeting. If Powell changes his position from the last meeting that "a pause in rate hikes will not be included in this year's benchmark issue" and instead adopts a more dovish tone, then the dollar index will see a sharp drop.
Market data suggests that the probability of the Fed ending the year with rates between 4.25-4.50% has reached 83%, while the probability of ending the year with rates between 4.50-4.75% has dropped to 17%. This data also suggests that the market does not expect the Fed to continue to raise rates significantly at its next meeting, which will provide stronger support for the cryptocurrency market.
The decline in the US dollar index will attract a large number of investors to the US dollar-denominated BTC market.
Technical analysis: From a technical perspective, BTC is currently on the 4H chart of the Elliott Wave push, which has set the stage for the start of the fourth wave. If this pattern is to build a fifth wave, then the key support level of the current structure will move up to the S3 price range. In terms of the medium-term layout, the end of the above-mentioned fifth wave would be at T1 near 31,300, T2 near 34,000, and T3 near 38,300.
If short-term prices fall to S2 and oscillate around the midline, a relatively common triangle pattern could easily form. In the short term, the market is still waiting for the May 2 meeting to land and form a triangle pattern for an upward breakout.
One scenario to keep in mind is that if Powell continues his strongly hawkish tone at the interest rate meeting, the dollar will continue to be supported in the short term. If BTC is influenced by fundamental analysis and falls below the support level of S3, the pattern will be broken and we will consider the whole trend as a head and shoulders bottom pattern. Therefore, a short-term correction may occur during the meeting, but considering that the Fed's continued rate hikes may trigger market fears of recession, speculative products such as cryptocurrencies can still continue to build long positions after the fundamental analysis stabilizes.

BANK OF AMERICA Stock Chart Fibonacci Analysis 042623Trading Idea
1) Find a FIBO slingshot
2) Check FIBO 61.80% level
3) Entry Point > 28.7/61.80%
