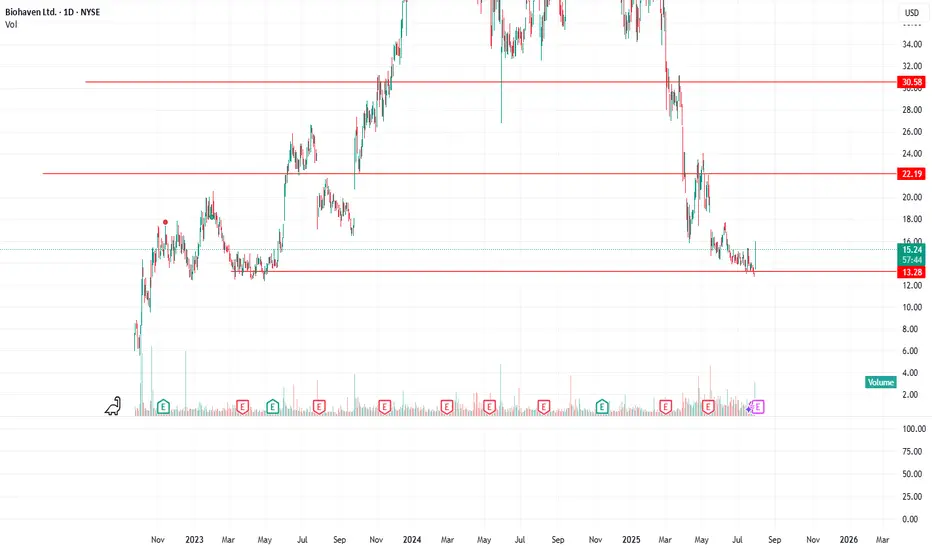
BHVN at long term support lineBottoming signs near $13.20 with today's strong bounce.
Still inside a high-risk consolidation zone, but momentum is shifting bullish.
Watch for a follow-through move above $16.30–17.00 to confirm potential uptrend.
Ideal spot for early positioning, but confirmation is still needed.
BHVN trade ideas
BHVN 52 Week HighBHVN hit a 52 week high on my scanner 1/8/2023 with very good volume and a strong closing candle. If this takes out the high of the high tomorrow, then this stock is in play. Be sure to wait for things to settle down for at least 15 minutes after the opening bell before making any trading decisions.
The 2 methods I like to use in these cases:
1: Wait for the price to stay above the high of the previous day (green line, 47.17) for at least 15 minutes before taking a trade and set your stop at the low of the previous day (red line, 42.69).
2: If the price stays above the high of the previous day (green line, 47.17) for at least 15 minutes, add the stock to a watch list, and wait for a pullback to an EMA that has held it well and then buy it with a stop below that EMA. In the case for BHVN, it looks like both the EMA 8 and EMA 21 have acted as support, so I would be aware that the bottoming wicks could reach down to the 21 EMA periodically when managing the trade.
These are the basic setups I use, but I will also consider support lines, AVAPs, etc. I will note these in my ideas if I use them.

BHVN - Potential Trend Continuation to BearishBHVN formed a head & shoulder pattern which reversed the trend to bearish. Later, it started printing LHs and LLs which is still applicable. Moreover, it has formed a descending triangle which is a bearish continuation pattern.

HS formingChart says everything. A massive HS is forming, it may take a few more days to break the support, I have a short position, if it breaks down, it will drop very fast.

Stock Idea: $BHVN (2 Feb 2023)$BHVN
- Young biotech stock (IPO-ed in 2022)
- Broke out from IPO base back in Jan, and now building a tight pennant
- Biotechs $IBB $XBI $LABU are acting right as a sector

$BHVN with a Bearish outlook following its earnings #Stocks The PEAD projected a Bearish outlook for $BHVN after a Negative over reaction following its earnings release placing the stock in drift C.

BHVN and AUPH overlap.. very similar chart since marchBHVN was bought out but the chart pattern is very similar except BHVN was going down more steeply for last 6 weeks. Both names figured in goldman's list for potential BO targets.

$BHVN: BullhavenWith an increasingly strong dollar and crude oil prices on the move there's some belief the Fed could need to move faster on rate hikes than previously planned. This should be a net positive for BHVN assuming. Were hoping most of the rout from XLV and IBB will clear soon against the backdrop of a strong dollar.

FDA Approves Biohaven's NURTEC® ODT (rimegepant) for Prevention:BHVN: Biohaven Pharmaceutical Holding Company Ltd.
2021-05-27 16:00:00
FDA Approves Biohaven's NURTEC® ODT (rimegepant) for Prevention: Now the First and Only Migraine Medication for both Acute and Preventive Treatment


BHVN, Aroon Indicator entered an Uptrend on Nov 13, 2020.Over the last three days, Tickeron's A.I.dvisor has detected that BHVN's AroonUp green line (see chart) is above 70, while the AroonDown red line is below 30. When the green line goes above 70 while the red line stays below 30, this is an indicator that the stock could be poised for a strong Uptrend. For traders, this could mean going long the stock or exploring call options in the next month. Tickeron's A.I.dvisor backtested this indicator and found 186 similar cases, 170 of which were successful. Based on this data, the odds of success are 90%. Current price $94.99 is above $77.98 the highest resistance line found by Tickeron A.I. Throughout the month of 10/14/20 - 11/13/20, the price experienced a +23% Uptrend. During the week of 11/06/20 - 11/13/20, the stock enjoyed a +12% Uptrend growth.
Bullish Trend Analysis
The Momentum Indicator moved above the 0 level on November 03, 2020. You may want to consider a long position or call options on BHVN as a result. Tickeron A.I. detected that in 52 of 64 past instances where the momentum indicator moved above 0, the stock continued to climb. The odds of a continued upward trend are 81%.
The Moving Average Convergence Divergence (MACD) for BHVN just turned positive on November 04, 2020. Looking at past instances where BHVN's MACD turned positive, the stock continued to rise, Tickeron A.I. shows that in 29 of 34 cases over the following month. The odds of a continued upward trend are 85%.
The 10-day Moving Average for BHVN crossed bullishly above the 50-day moving average on October 02, 2020. This indicates that the trend has shifted higher and could be considered a buy signal. Tickeron A.I. detected that in 9 of 10 past instances when the 10-day crossed above the 50-day, the stock continued to move higher over the following month. The odds of a continued upward trend are 90%.
Following a +14.49% 3-day Advance, the price is estimated to grow further. Considering data from situations where BHVN advanced for three days, in 182 of 213 cases, the price rose further within the following month. The odds of a continued upward trend are 85%.
The Aroon Indicator entered an Uptrend today. Tickeron A.I. detected that in 170 of 186 cases where BHVN Aroon's Indicator entered an Uptrend, the price rose further within the following month. The odds of a continued Uptrend are 90%.

BHVN, Aroon Indicator entered an Uptrend on Nov 09, 2020.Over the last three days, Tickeron A.I.dvisor has detected that BHVN's AroonUp green line (see chart) is above 70, while the AroonDown red line is below 30. When the green line goes above 70 while the red line stays below 30, this is an indicator that the stock could be poised for a strong Uptrend. For traders, this could mean going long the stock or exploring call options in the next month. Tickeron A.I.dvisor backtested this indicator and found 186 similar cases, 170 of which were successful. Based on this data, the odds of success are 90%. Current price $85.62 is above $77.98 the highest resistance line found by Tickeron A.I. Throughout the month of 10/08/20 - 11/09/20, the price experienced a +5% Uptrend. During the week of 11/02/20 - 11/09/20, the stock enjoyed a +5% Uptrend growth.
Bullish Trend Analysis
The Momentum Indicator moved above the 0 level on November 03, 2020. You may want to consider a long position or call options on BHVN as a result. Tickeron A.I. detected that in 56 of 64 past instances where the momentum indicator moved above 0, the stock continued to climb. The odds of a continued upward trend are 88%.
BHVN moved above its 50-day Moving Average on September 30, 2020 date and that indicates a change from a downward trend to an upward trend.
The 10-day Moving Average for BHVN crossed bullishly above the 50-day moving average on October 02, 2020. This indicates that the trend has shifted higher and could be considered a buy signal. Tickeron A.I. detected that in 9 of 10 past instances when the 10-day crossed above the 50-day, the stock continued to move higher over the following month. The odds of a continued upward trend are 90%.
Following a +14.63% 3-day Advance, the price is estimated to grow further. Considering data from situations where BHVN advanced for three days, in 177 of 208 cases, the price rose further within the following month. The odds of a continued upward trend are 85%.
The Aroon Indicator entered an Uptrend today. Tickeron A.I. detected that in 170 of 186 cases where BHVN Aroon's Indicator entered an Uptrend, the price rose further within the following month. The odds of a continued Uptrend are 90%.


BHVN, Aroon Indicator entered an Uptrend on Oct 21, 2020.Over the last three days, Tickeron A.I.dvisor has detected that BHVN's AroonUp green line (see chart) is above 70, while the AroonDown red line is below 30. When the green line goes above 70 while the red line stays below 30, this is an indicator that the stock could be poised for a strong Uptrend. For traders, this could mean going long the stock or exploring call options in the next month. Tickeron A.I.dvisor backtested this indicator and found 186 similar cases, 170 of which were successful. Based on this data, the odds of success are 90%. Current price $78.71 is above $75.89 the highest resistance line found by Tickeron A.I. Throughout the month of 09/21/20 - 10/21/20, the price experienced a +30% Uptrend. During the week of 10/14/20 - 10/21/20, the stock enjoyed a +0.95% Uptrend growth.
Bullish Trend Analysis
The Moving Average Convergence Divergence (MACD) for BHVN just turned positive on August 31, 2020. Looking at past instances where BHVN's MACD turned positive, the stock continued to rise Tickeron A.I. shows that in 29 of 32 cases over the following month. The odds of a continued upward trend are 90%.
BHVN moved above its 50-day Moving Average on September 30, 2020 date and that indicates a change from a downward trend to an upward trend.
The 10-day Moving Average for BHVN crossed bullishly above the 50-day moving average on October 02, 2020. This indicates that the trend has shifted higher and could be considered a buy signal. Tickeron A.I. detected that in 10 of 10 past instances when the 10-day crossed above the 50-day, the stock continued to move higher over the following month. The odds of a continued upward trend are 90%.
Following a +1.35% 3-day Advance, the price is estimated to grow further. Considering data from situations where BHVN advanced for three days, in 174 of 205 cases, the price rose further within the following month. The odds of a continued upward trend are 85%.
The Aroon Indicator entered an Uptrend today. Tickeron A.I. detected that in 170 of 186 cases where BHVN Aroon's Indicator entered an Uptrend, the price rose further within the following month. The odds of a continued Uptrend are 90%.


BHVN Aroon Indicator entered an Uptrend on June 19, 2020A buy signal is generated. When the green line goes above 70 while the red line stays below 30, this is an indicator that the stock could be poised for a strong Uptrend. For traders, this could mean going long the stock or exploring call options in the next month. I backtested this indicator and found 162 similar cases, 149 of which were successful. Based on this data, the odds of success are 90%.


BHVN 16H chart: BUY/HOLD 40% gains(STOCKS)Why get subbed to to me on Tradingview?
-TOP author on TradingView
-15+ years experience in markets
-Professional chart break downs
-Supply/Demand Zones
-TD9 counts / combo review
-Key S/R levels
-No junk on my charts
-Frequent updates
-Covering FX/crypto/US stocks
-24/7 uptime so constant updates
BHVN 16H chart: BUY/HOLD 40% gains(NEW)
🔸 Summary and potential trade setup
. BHVN 16H chart review and strategy
. Biotech sector outperforming market
. in 2020 due to corona hype
. XABCD setup, strong upside from here
. TP bulls is point D +40% gains
. runaway gap, bye bye bears
. BUY mild dips / market BUY
. TP bulls is 70//72 in 60-90 days
. which is 40% upside from here
. setup for patient traders
. DO NOT expect overnight gains
. This is stock market
. Not casino in Macau
🔸 Supply/Demand Zones
. N/A
🔸 Why should I follow your setups?
. Check track record it's all been posted
. MNRA 200%+ gains, NVAX 300% gains, REG 60%
. AMD 40% gains and a lot more in recent months

BIOHAVEN PHARMACEUTICALNYSE:BHVN
Another interesting paper.
Couldn't take the historical level at 55.96.
It was a long-distance retest.
Rolled back down a bit.
These are possible scenarios for this trade:
1. A breakout of the level, however, it's obvious there will be a pullback. The priority is to go to a false breakdown with a technical SL.
But it's pharmaceutical, you have to be very careful with short.
2. Level breakout, rollback and fixation above the level.
Enter the long after retest. short SL under the local level.
No matter what strategy you are trading on, the scenario is good that they have short SLs.
Trade wisely!

BHVN - Inv. H&S To Short Squeeze BHVN Short float is very high (over 20%)
to take full advantage of a short squeeze the stock created a inverted head and shoulders pattern
looks like covers are ready to buy above 52$

