$BMA can rise in the next daysContextual immersion trading strategy idea.
Banco Macro S.A. provides various banking products and services to retail and corporate customers in Argentina.
The demand for shares of the company still looks higher than the supply.
This and other conditions can cause a rise in the share price in the next days.
So I opened a long position from $15.30;
stop-loss — $14.38.
Information about take-profits will be later.
Do not view this idea as a recommendation for trading or investing. It is published only to introduce my own vision.
Always do your own analysis before making deals. When you use any materials, do not rely on blind trust.
You should remember that isolated deals do not give systematic profit, so trade/invest using a developed strategy.
If you like my content, you can subscribe to the news and receive my fresh ideas.
Thanks for being with me!
BMA trade ideas

BMA slowly coming at stage!Last QR earnings beaten. Chart is flatting. Slowly going through the resistances. It will last a while, but a gain can be huge.
Stop loss : 12.30
Buy entry, anywhere above SP.
Price targets :
1PT 18.62
2PT 24.16
3PT 28.53
4PT 32.26
5PT 36.22
6PT 50.17
7PT 58.40
8PT 67.49
9PT 75.23
10PT 86.94
Above that.... Noone knows. But i dont really believe it will go this high :)
But it's at least 5years trip

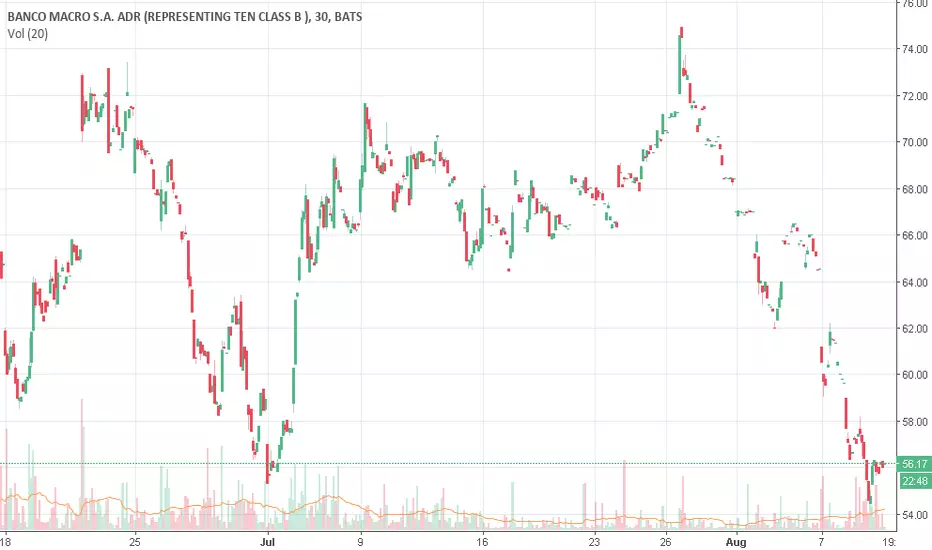
Argy banks adding volumeThe 4 ADRs increased volume very noticeably in the last few wheels at the same time as they hit the top of the sideways Bollinger in which they are developing. While the second Bollinger implies a higher range of higher volatility, the previous sentence leaves me with the impression that even this move is coming and that the banks are getting ready to pull back a bit... not too much, I would think, being that the trend of the last few months is sideways.
On a positive note, it is worth noting that they all made higher highs than previous highs, with the exception of SUPV and its usual rebelliousness.


BMA Technical Analysis 🧙Banco Macro SA is a financial institution and it provides standard banking products and services designed to suit individual needs. It has two categories of customers, retail customers, which include individuals and entrepreneurs, and corporate customers, which include small, medium, and large companies and corporations. In addition, it provides services to four provincial governments. The firm generates most of its revenue from Argentina.
If you understand the idea,🎯 press a thumb up! 👍 Have a question? Don't be shy to ask! 🤓 Interested to study how to analyze charts, follow me!

#bma EEUUGRAN reunion de traders gracias a todos fue excelente la participación ... analizamos mas de 20 activos $bma #gold $txar $come #ko $sami #nvda #ba #x #wti #hmi $mori $ypf $teco $ceco $trans $byma $dgcu $auy $ggal $merval $imv planeta trading by Versa
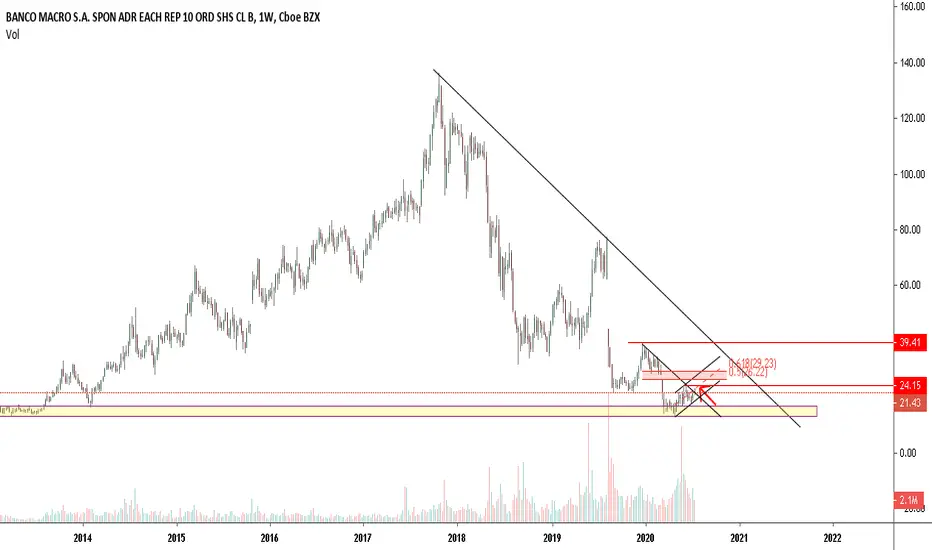
Lo peor ya pasó$BMA está haciendo piso en el gráfico de comprensión semanal, luego de las fuertes caídas de esta semana tras la vinculación de su presidente y principal accionista con el testaferro del ex presidente Boudou.

This is NOT a double bottomWe often take a double bottom to be a sign of a bullish market structure.
A double bottom with a breakout ends up looking like a 'W'.
However, it's NOT double bottom when the second low is LOWER than the first low.
The second leg must be EQUAL or SLIGHTLY GREATER than the first low, for it to be considered a valid 'W'.
Why? Well, the second leg of the double bottom is just a test of the first initial lows.
If we break those old lows, we haven't really established a bottom.
I can see how taking this trade may have been tempting; it's pretty damn close to a 'W'.
But not quite, and it's evident what happened shortly afterwards.

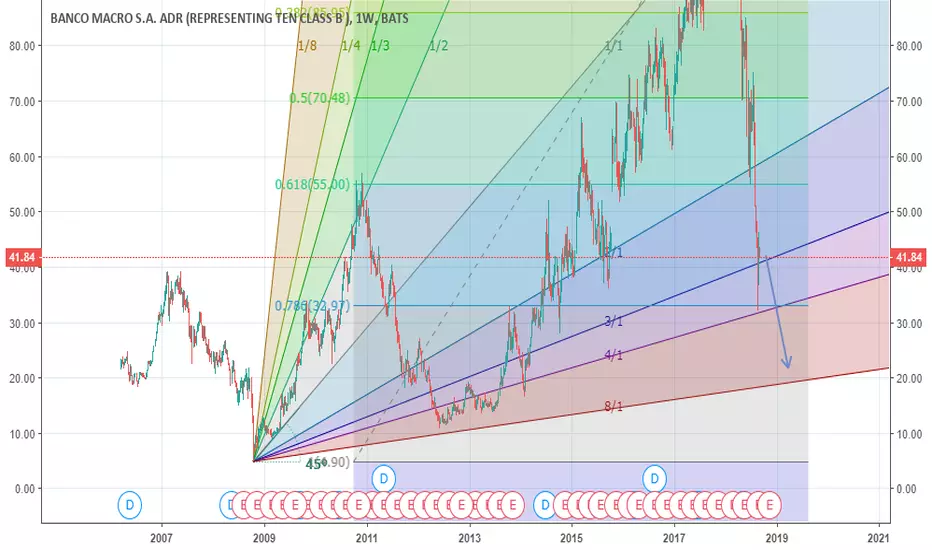
short BMAI expect BMA to fall to 12 by early December taking into account Argentina macroeconomic as well as FX situation and volatility in EM.
A tgt between 20/25 by Early december.
BMA mini cup and handle?BMA forming a coup and handle patter. This could be a huge potential for the stock IMO!
However geopolitical uncertainties and usual trade wars crap, might screw up this beautiful chart!
OTRO 22% EN PESOS ES POSIBLE CON BMAROMPE RESISTENCIA DE CORTO PLAZO Y VA A IR A BUSCAR EL TECHO DEL CANAL DESDOBLADO

Por chocarse la cabeza contra resistencia relevanteMás allá de estar a apenas 2 dólares de una resistencia importante, el MACD está empezando a darse vuelta. Con la recorrida que tuvo, lo más inteligente parece ser salir.

$BMANYSE:BMA ADR del papel argentino analizado en compresión diaria, presenta un lindo banderín en la zona entre 89,75 y 62,6 coincidente también entre las líneas de extensión de Fibonacci de 1,236 y 1. Punto importante a notar es el achatamiento del MACD cerca de un valor histórico de 6,19. Podría mostrar un probable cambio de concavidad o simplemente un descanso para luego superar o alcanzar dicho máximo histórico del valor del oscilador mencionado. RSI retrocede de la zona de sobrecompra pero sigue en tendencia alcista, vuelve a un valor de soporte tomando la línea de tendencia de color azul en el indicador. Resistencias fuertes que podemos esperar son la zona de 75,7 a 76,1 (resistencia histórica + 1,5 de Fibonacci) y 85,40 otra resistencia histórica.

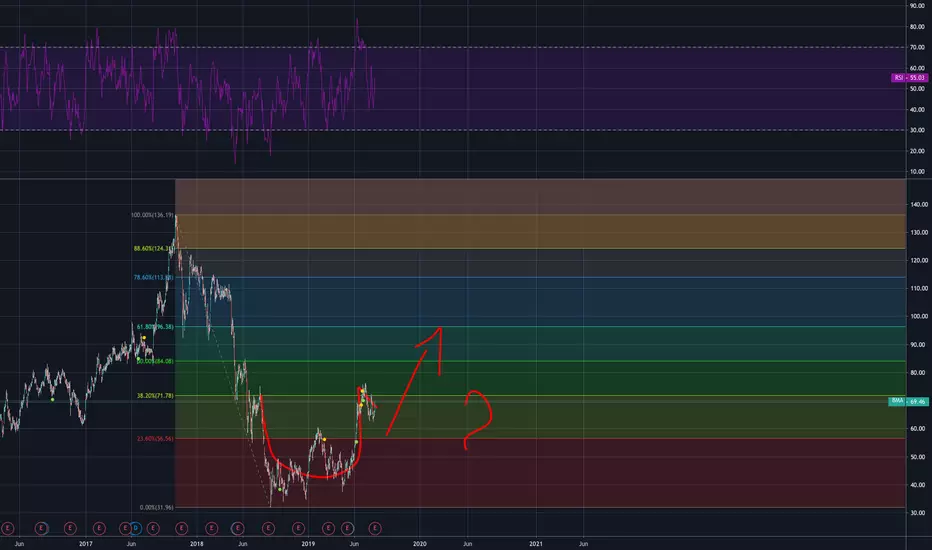
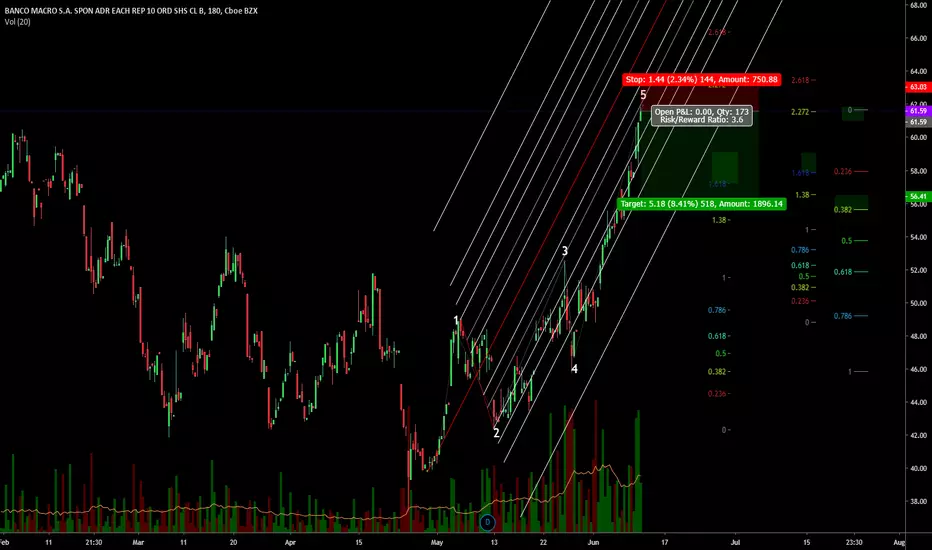
I think its a good time for the fifth wave to finishI think its a fair setup, given that we have already exceeded other targets


BANCO MACRO ADR DIARIO No pudo con la ema20
clave que no pierda los 49.50 para seguir up
STOP LOSS: 49
Veremos esta semana, la veo lateralizando

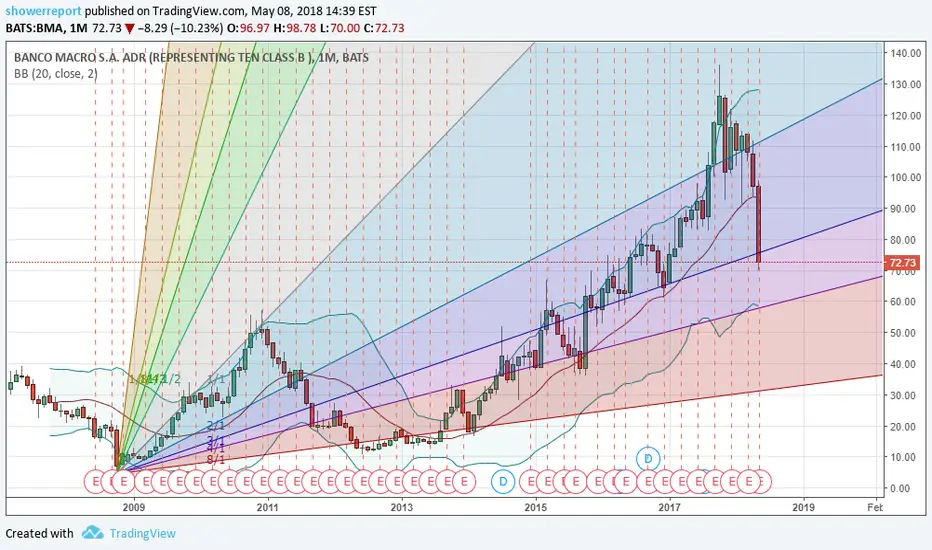
Banco Macro ADR Long
Monthly view, green line very important. Lots of confluence.
Daily view.
Failure of setup is if 33 doesnt hold.

Volume says BUY BUY BUY - El voumen grita COMPRAArgentinian Banks have been suffering.
However, we have seen HUGE hands buying in the 43-46 price range.

BMA Detected possible stock repurchase!!!BMA: banco macro s.a.
2018-08-08 18:56:27
Detected possible stock repurchase
BMA09/05 BMA ER is unconfirmed but I think that BMA has 6% to 15% downfall but after that, ultra bull.
Testeo Fib 0,236- Oportunidad de compraBanco Francés, los objetivos son: 1- ingresar en Fib 0,236 (18,33). 2-superar M.A 50 (18,71) 3- Últimos picos del tramo bajista (19,50); (19,87); (21,08). Stop loss: (17,74)
