BTE trade ideas

Baytex Energy Reversal targets $bteBaytex Energy Corp. is an oil & gas exploration and production company. The firm engages in the acquisition, development and production of crude oil and natural gas in the Western Canadian Sedimentary Basin and in the Eagle Ford in the United States. The company was founded on June 3, 1993 and is headquartered in Calgary, Canad
Andrew Aponas | Large SpikeDisclaimer: thank you for taking your time to look at my idea please understand that I didn't publish it to influence your decision to invest your money and void myself of any responsibility towards your investments.
Note: I am simply trying to increase the coverage that the company may or may not have by publishing an optimistic guess I don't know anything about the company I am publishing the idea about, I haven't done any research on the company, I don't know what it's operations are, or if it's profitable.
Tip: Check WSJ.com or another professional service if your looking for something you can't find here.
Thank You, +AndrewAponas+
P.S. I apologize for any inconvenience my publication could have caused you.

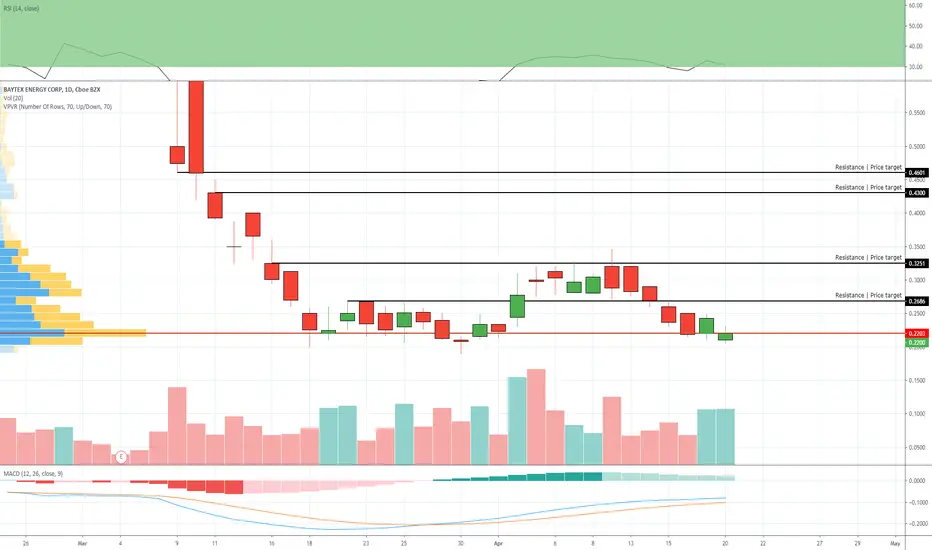
shortseeing rejection on longer term downtrend with gap rejection as well. Pulled back to .618 looks like we can find a quick short here


Bullish hereBullish here on BTE. Love the Oil and Gas sector right now and have for a while. Broken several market structure resistance and forming bullish pennant with two significant levels of support below and a lot less immediate resistance ahead. Could consolidate here for a while based on the MACD history but looking for a break up out of the pennant!!
See what happens!

Bullish Long The more I am looking at the resource sector and how active it has been lately the more bullish and excited I am for it. Here is a quick observation of BTE


BTE OutlookBTE is setting up nicely for a buy off all time lows. From the weekly we've found major support areas between 2.01-2.20 price area. Trading within a descending wedge on the W1/D1. The double top on the D1 formed since Feb 8th has created a bullish cypher pattern and this is the area where we'd expect to buy the D. If you get a continuation this cypher pattern is valid. If the pattern is repeated we can look for this setup to continue bullish.
Daily:
Weekly

Keep an eye on this oneBroke the 50EMA, RSI is bullish. Volume is strong and it seems to want to go up.


Buying BTE $3.32 1 hour oversoldAll the negatives appear to be built in. With 1/3 of the total production price to WTI in USD, BTE at this price has great reward to risk ratios. Too early to call a trend reverslaes but this is how they happen.


BTE Momo/Swing Play LongEntry below 2.19, stop 1.98 (not as tight as I'd like but it needs room to trade), exit 2.51.

Long BTE b/w 2.04 & 2.13; Target 2.47-2.53Looking for a long b/s the most immediate low @ 2.04 on hourly and 2.13. However, only a Close above 2.18 on hourly is likely to confirm a short term retrace to 2.50; prior support zone on daily.
Here's a look at the short term hourly chart with the bullish divergence signals.

A possible short term case for a $3.49 reboundRSI of less than 30 on the daily chart shows a strong potential for a rebound from there level which could learn to a full reversal longer term. Today appears to have been the start of it with significant bull volume and a 6% gain. If we gap up on Monday above $3.15, we'll see $3.49 intraday or Tuesday and bullish reversal will be confirmed. Bears are tenacious but with oil analysts on TV highlighting the value of BTE, buyers will likely be researching this stock and understanding that at such a low stock price to value, a larger oil company will take out BTE. The upsides from sub $3 and low $3 far outweighs the downsides. But do not be surprised to see consolidation and some weakness as we break the $3 barrier. Bullish Reversal is not yet confirmed. Daily candlesticks shows pending inverted bullish hammer. Let's see if the reversal is confirmed Monday. Trade appropriately in the meantime. If you are a longer term investor, consider averaging down sub $3s and ensure you don't position yourself having to sell on margin calls.

Double bottom on $2.97. Perfect levels for an aggressive bounceWe're hitting long term support levels just under $3. Last of the stop loses were flushed and we can expect an rebound from here. Let's see if the bounce if a reversal or just a bounce.

$BTE | Getting Ready for BIG MOVEHello Traders,
My model has identified a great opportunity in BTE. Targets defined on chart. This is a long term strategy.

potentil Elliott wave pattern on BTE TSX:BTE
We can see a support level form on BTE at around $4.22 after the Trent down since May, with the increase in volume on the 10th to the 12th we could see a short sell off then due to anticipation of the earnings report the speculators could buy in to follow a $ stage Elliott wave.

BTE may need patienceWaiting for a deeper pull back closer to 3.50 support. It may flag out for a bit before then.

Baytex Energy UptrendBTE dropping off of highs. Predict drop to S3 uptrend around 3.55. If fail this is a no go. Would look for rise between R2 and R3 at 5.00. Need RSI to deplete more. Possible Bull Cypher pattern.

Baytex Before Earnings (May 4, 2018)BTE.TO was supposed to outperform as long as the price of oil stays above 66$ since December. As you can see, its up by 89%. The could be a potential gap up and shorting opportunity (intraday). If anyone has any suggestions or corrections. Comments are much appreciated as I am always willing to learn.
