CAL - Apparel retailer attempting to breakoutRetailer leader. New 52wk highs. Multiple basing patterns. Ready to make a move.
You don't need to know what's going to happen next to make money ~Mark Douglas
Lose like a pro and keep trading, or lose like a novice and quit ~Mark Ritchie
Next report date
—
Report period
—
EPS estimate
—
Revenue estimate
—
2.40 USD
103.42 M USD
2.72 B USD
32.33 M
About Caleres, Inc.
Sector
Industry
CEO
John W. Schmidt
Website
Headquarters
St. Louis
Founded
1878
FIGI
BBG000CYSFS7
Caleres, Inc. engages in the provision of athletic, casual, and dress footwear products. It operates through the Famous Footwear and Brand Portfolio segments. The Famous Footwear segment provides branded footwear for the entire family. The Brand Portfolio segment sources, manufactures, and markets branded, licensed, and private-labeled footwear primarily to online retailers, national chains, department stores, mass merchandisers, and independent retailers. The company was founded by George Warren Brown in 1878 and is headquartered in St. Louis, MO.
Related stocks

$CAL is breaking out of a ~15 month long base. Can it go higher?Notes:
* Strong up trend since March 2020
* Good earnings in the recent quarters
* Basing for the past ~15 months
* Broke out around the end of May but pulled back to its 200 day line
* Currently breaking out of historical resistance of $29.85 with higher than average volume
* Next historical resis

Is $CAL ready to move higher after pulling back?Notes:
* Strong up trend since 2020
* Great earnings in the recent quarters
* Pays out dividends
* Creating a base for the past ~14 months
* Recently bounced from its 200 day
* Pulled back to its 50 day and is now showing signs of recovery with volume
* Historical resistance comes in around 29.85

Is $CAL ready to push higher?Notes:
* Strong up trend
* Great earnings
* Breaking out of a ~13 month base with higher than average volume
* Forming a bull flag
Technicals:
Sector: Consumer Cyclical - Footwear & Accessories
Relative Strength vs. Sector: 2.2
Relative Strength vs. SP500: 3.32
U/D Ratio: 1.52
Base Depth: 56.68

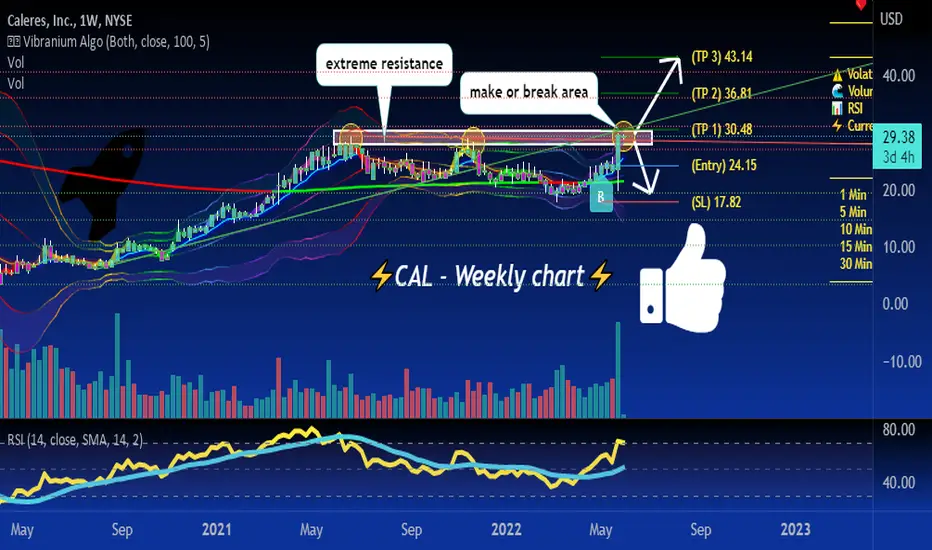
CAL at make or break it area 👀If it can break above some potential targets are 36.81-43.14, but a rejection here can send us back to 18-24 supports. not too clear which way we are headed yet. wait for confirmation


Price action & Psychology - Breakout and first pullbackHello !
I am so excited for the week ahead.
Key points :
Breakout after consolidation + spike in volume
Volume on uptrends is higher than on downtrends
First pullback after breakout (61.8% Fibonacci retracement)
Holding support despite the fact that the overall market was down on friday

CAL correcting bearish trend with Daily Bullish Breakout Cal has established a bullish daily breakout with a strong candle bar and good volume offering an opportunity for further gains. The stock is in a strong bearish trend in the Weekly and Monthly Charts. However, we may still trade the bullish momentum for a short time.

CALShare prices are looking for support at 32.05 currently trading at 32.20 with supporting volume. Support and resistance are marked on the chart

See all ideas
Summarizing what the indicators are suggesting.
Neutral
SellBuy
Strong sellStrong buy
Strong sellSellNeutralBuyStrong buy
Neutral
SellBuy
Strong sellStrong buy
Strong sellSellNeutralBuyStrong buy
Neutral
SellBuy
Strong sellStrong buy
Strong sellSellNeutralBuyStrong buy
An aggregate view of professional's ratings.
Neutral
SellBuy
Strong sellStrong buy
Strong sellSellNeutralBuyStrong buy
Neutral
SellBuy
Strong sellStrong buy
Strong sellSellNeutralBuyStrong buy
Neutral
SellBuy
Strong sellStrong buy
Strong sellSellNeutralBuyStrong buy
Displays a symbol's price movements over previous years to identify recurring trends.
Curated watchlists where CAL is featured.


Frequently Asked Questions
The current price of CAL is 13.17 USD — it has decreased by −3.20% in the past 24 hours. Watch Caleres, Inc. stock price performance more closely on the chart.
Depending on the exchange, the stock ticker may vary. For instance, on NYSE exchange Caleres, Inc. stocks are traded under the ticker CAL.
CAL stock has fallen by −13.42% compared to the previous week, the last month showed zero change in price, over the last year Caleres, Inc. has showed a −65.92% decrease.
We've gathered analysts' opinions on Caleres, Inc. future price: according to them, CAL price has a max estimate of 21.00 USD and a min estimate of 18.00 USD. Watch CAL chart and read a more detailed Caleres, Inc. stock forecast: see what analysts think of Caleres, Inc. and suggest that you do with its stocks.
CAL stock is 6.15% volatile and has beta coefficient of 0.94. Track Caleres, Inc. stock price on the chart and check out the list of the most volatile stocks — is Caleres, Inc. there?
Today Caleres, Inc. has the market capitalization of 445.10 M, it has decreased by −7.53% over the last week.
Yes, you can track Caleres, Inc. financials in yearly and quarterly reports right on TradingView.
Caleres, Inc. is going to release the next earnings report on Aug 27, 2025. Keep track of upcoming events with our Earnings Calendar.
CAL earnings for the last quarter are 0.22 USD per share, whereas the estimation was 0.36 USD resulting in a −39.50% surprise. The estimated earnings for the next quarter are 0.56 USD per share. See more details about Caleres, Inc. earnings.
Caleres, Inc. revenue for the last quarter amounts to 614.22 M USD, despite the estimated figure of 622.05 M USD. In the next quarter, revenue is expected to reach 656.94 M USD.
CAL net income for the last quarter is 6.70 M USD, while the quarter before that showed 4.76 M USD of net income which accounts for 40.65% change. Track more Caleres, Inc. financial stats to get the full picture.
Yes, CAL dividends are paid quarterly. The last dividend per share was 0.07 USD. As of today, Dividend Yield (TTM)% is 2.13%. Tracking Caleres, Inc. dividends might help you take more informed decisions.
Caleres, Inc. dividend yield was 1.63% in 2024, and payout ratio reached 9.07%. The year before the numbers were 0.88% and 5.84% correspondingly. See high-dividend stocks and find more opportunities for your portfolio.
As of Aug 2, 2025, the company has 9.4 K employees. See our rating of the largest employees — is Caleres, Inc. on this list?
EBITDA measures a company's operating performance, its growth signifies an improvement in the efficiency of a company. Caleres, Inc. EBITDA is 186.09 M USD, and current EBITDA margin is 7.91%. See more stats in Caleres, Inc. financial statements.
Like other stocks, CAL shares are traded on stock exchanges, e.g. Nasdaq, Nyse, Euronext, and the easiest way to buy them is through an online stock broker. To do this, you need to open an account and follow a broker's procedures, then start trading. You can trade Caleres, Inc. stock right from TradingView charts — choose your broker and connect to your account.
Investing in stocks requires a comprehensive research: you should carefully study all the available data, e.g. company's financials, related news, and its technical analysis. So Caleres, Inc. technincal analysis shows the strong sell today, and its 1 week rating is sell. Since market conditions are prone to changes, it's worth looking a bit further into the future — according to the 1 month rating Caleres, Inc. stock shows the sell signal. See more of Caleres, Inc. technicals for a more comprehensive analysis.
If you're still not sure, try looking for inspiration in our curated watchlists.
If you're still not sure, try looking for inspiration in our curated watchlists.