Warren Buffett absolutely chilling today - CBBuffett's investment in CB seems to be playing well into tariff volatility.
CB trade ideas

CB Looking For More UpsideCB has reversed its short-term downtrend and is now looking to stay bullish. It has a couple of touches at the top channel along with some nice rejection of support even with heavy bar influence. I see CB as a great long prospect.

CB in Sell ZoneMy trading plan is very simple.
I buy or sell when at three of these events happen:
* Price tags the top or bottom of parallel channel zones
* Money flow spikes beyond it's Bollinger Bands
* Stochastic Momentum Index (SMI) at near oversold overbought level
* Price at Fibonacci levels
So...
Here's why I'm picking this symbol to do the thing.
Price in selling zone at top of channels
Stochastic Momentum Index (SMI) at overbought level
Money flow momentum is spiked positive and over top of Bollinger Band
Entry at $279.88
Target is lower channel around $264

Bearish Alert: Chubb Limited (CB) Targeting $244.94 Support! Chubb Limited (CB) is showing clear signs of bearish momentum, with repeated lower highs and lows signaling potential further downside. The rejection at recent highs and a lack of buying strength suggest the price could break lower, targeting the critical support level at $244.94. The Ichimoku Cloud confirms bearish dominance, making this a key level to watch. A breakdown below minor supports could trigger a sharp move down to $244.94. Stay alert for this potential drop! 📉🔥

Chubb (CB): Buffett Buy
Warren Buffett just bought this stock called CHUBB (stock symbol is CB). Here is my chart with a new buy signal on Friday. You can visually see that it will move up. And with Warren Buffett piling in, you have a whale on your side if you throw money at it and hold for the next 5 years.
www.forbes.com

Chubb Stock Jumps After Buffett's Berkshire Reveals $6.7B StakeChubb shares ( NYSE:CB ) jumped over 8% in late trade on Wednesday after Warren Buffett's Berkshire Hathaway revealed a $6.7 billion stake in the Zurich-based insurer. Buffett recently told shareholders that property-casualty insurance provides the core of Berkshire's well-being and growth. Berkshire had been building its position in Chubb since 2023, but had not previously disclosed the stake after the SEC granted it permission to keep the holding confidential.
Berkshire's stake of nearly 26 million shares in Chubb ( NYSE:CB ), one of the world's largest publicly traded property-casualty insurers, had a market value of around $6.7 billion as of March 31, making it the conglomerate's nineth largest holding. The investment is driven by Berkshire's heavy footprint in the insurance industry, which Buffett recently told shareholders that "property-casualty insurance" provides the core of Berkshire's well-being and growth.
The stock has continued to track higher since bottoming out in June last year, with the trend gathering momentum after the 50-day moving average crossed above the 200-day MA to form a bullish golden cross signal. Recently, the stock has traded within an ascending triangle, indicating a continuation of the longer-term uptrend.
Moreover, Chubb ( NYSE:CB ) has a Relative Strength Index (RSI) of 71.75 which is overbought hence, a trend reversal might lurk in the corners.

Short on CB
CB is currently in an ascending channel with bearish RSI divergence. Has hit resistance at top of channel just wait for break of trendline on smaller time frame, stoploss above last swing high with target at next resistance level, moving SL to BE when safe to do so.

Chubb... Time to lock in profits ???A combination of harmonic (Bearish Crab), an ABCD pattern, a significant fib retracement, a pending momentum rollover and negative divergence makes CHUBB a potential short IF the broader markets roll over.
$225 may be an area worth considering....
TV rates this a strong BUY.....
Worth watching... no action suggested yet... let general market softness be your guide.
If it happens it happens,,,
Not investment advice... as always do your own due diligence.
S

CB: targeting the target of the double bottom patternDouble Bottom Pattern: The stock has formed a classic double bottom pattern, which is often viewed as a bullish reversal signal. This pattern has two distinct lows (labelled as "Bottom 1" and "Bottom 2") at roughly the same price level, suggesting that the stock found strong support and buyers stepped in at those levels.
200-day Moving Average: The stock price recently breached the 200-day moving average, a positive sign as this is often considered a key level. A price above this average suggests the medium-term trend might be bullish.
Fibonacci Retracements: The stock appears to have found some resistance near the 0% retracement but has the potential to move towards higher retracement levels if the bullish momentum continues.
Target and Stop Levels: Based on the chart, the potential target is set at 224.00 (a gain of +3.6%), while the stop-loss is suggested at 212.00 (a possible loss of -1.9%). This provides a favourable risk-reward.
Increase Exposure Point: The chart indicates a suggestion to increase exposure around the 219.00 price level, which might be based on some key support or previously observed price action.

CB - head and shouldersOn the chart we can see the head and shoulders formation, which is bearish.
We are expecting a breakdown.
Enter the short position only if the price breaks the neckline.
Target and stop loss are shown on the chart.

CB with a bullish outlook following its earnings #StocksThe PEAD projected a bullish outlook for CB after a positive over reaction following its earnings release placing the stock in drift B with an expected accuracy of 70%.

April Gainers (CB, account up 0.38%)7th trade in April is NYSE:CB .
Holding period is 24 days (3/21/23-4/14/23).
Account is up 0.38%.
Total return in April is 1.15%

$CB with a Bullish outlook following its earnings #Stocks The PEAD projected a Bullish outlook for $CB after a Negative Under reaction following its earnings release placing the stock in drift D with an expected accuracy of 100%.

CB: mean reverting trade?A price action below 211.50 supports a bearish trend direction.
Also confirmation for a price action below 212.00.
Consolidation price range between 203.50 and 209.00.
Crossing below 203.50 supports the price action to reach 198.00.
MACD bearish crossover also applicable.

$CB with a Bullish outlook following its earnings #Stocks The PEAD projected a Bullish outlook for $CB after a Positive over reaction following its earnings release placing the stock in drift B with an expected accuracy of 66.67%.

Short $CB from 194,8$CB testing the highs of channel in a period of much uncertainty. I believe it will continue down.
Entry: 194,8
SL: 201
TP: 174,75

Chubb Corp (CB)Hello,
I see Head and scolders pattern, with targets (168 - 160 - 156 - 150) invalidation if it close 4 h above 188.
Also we are in correction wave could reach 120, so I think short is good here.
DYOR, Not Financial Advice.
Week NO 39

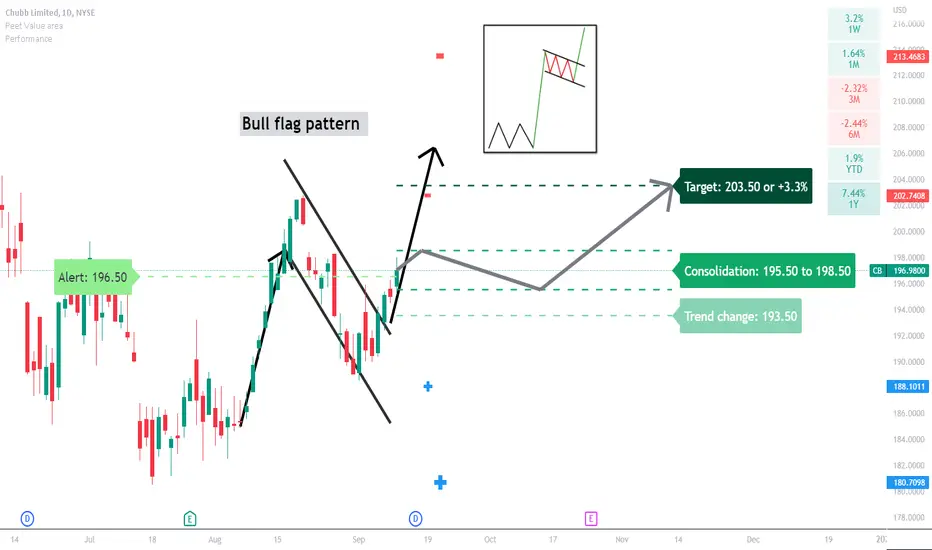
CB: bull flag patternA bull flag pattern might support further upside price potential.
A price action above 193.50 supports a bullish trend direction.
Crossing below this level will negate the bullish trend direction.
Further bullish trend support above 196.50.
Consolidation price range from 195.50 to 198.50.
Crossing above the 198.50 resistance might target 203.50.
Crossing below the 195.50 support might be the first sign of pending weakness.
$CB with a Bullish outlook following its earnings #Stocks The PEAD projected a Bullish outlook for $CB after a Positive over reaction following its earnings release placing the stock in drift B with an expected accuracy of 62.5%.

WATCH $CBBearish
Fundamental
- Strong industry group
- Funds are distributing
- Declining growth / earnings
TA
- Momentum theory divergence
- Momentum declining
- Price below 200/50 moving average


$CB with a Bullish outlook following its earnings #Stocks The PEAD projected a Bullish outlook for $CB after a Positive Under reaction following its earnings release placing the stock in drift A with an expected accuracy of 50%.

Breakout ideaNice uptrend in this name, waiting to see if price breaks out of this fresh new flag, or if we retest the trendline one more time.
Either way, it does look good.
