Cepu Long
This is the CEPU chart. Based on the Golden Numbers, 618. The chart is structured in zones 50 and 618, so we look for a buy zone since it's a bullish chart. We use Elliott waves, debts, and projection targets.
CEPU trade ideas

Down trend continues!!!!!!!!!This is a usa stock that broke out on the upsides and doesn’t fit into our criteria.
The way I play the game is different from the way others play the game ..
This trade can go low as 4.8 and retest the break out point .
I know some traders wouldn’t like this my analysis…. But as the sweetest boy if we don’t trade correctly we’ll cry in pains as the game is no respecter of no man

Accumulate CEPU as it consolidates?CEPU recently broke out from a range on good volume. Seems to now be testing the prior highs from above and is approaching a large accumulation volume profile node. CEPU has been trending higher on the daily and weekly charts. Energy is now starting to increase after having faced exhaustion on it's upward break out.
Outside of TA, CEPU has its debt to assets trending down for the last 3 years. Operating cashflow steady for the past couple years. It operates in the natural gas transport space which should factor in heavily as winter approaches and the Russian Ukraine war shows no signs of coming to an end.

CEPU - Aug 11
CEPU - Aug 11
looks that the buyers will take over soon
TP1= 4.0
TP2= 5.5
TP3= 10.5
just a thought, good luck with it


CEPU - Due for a BreakoutDaily chart
CEPU has been moving sideways since August 2019. Recently it has started to curl upwards on low volume. Might lead to a breakout.
Price Target - $5.50


Long trade in Central PuertoYield 2.18%
p/E RATIO 4.67
Central Puerto SA engages in the generation and distribution of electricity. It operates through the following segments: Electric Power Generation; Natural Gas Distribution; and Management and Operations. The Electric Power Generation segment produces and sells electric power. The Natural Gas Distribution includes public sector service in the Cuyo and Centro regions of Argentina. The Management and Operations segment manages thermal plants. The company was founded in 1989 and is headquartered in Buenos Aires, Argentina.


CEPU buscando el cabezazo.CEPU tiene muchas probabilidades de rebote, RSI en divergencia.
Paciencia y esperar el rebote.

CENTRAL PUERTO ADR DIARIO Bien jugando arriba del fibo0.236
clave que no pierda el soporte del fibo
No pudo con la ema20
STOP LOSS: 10 Dolares

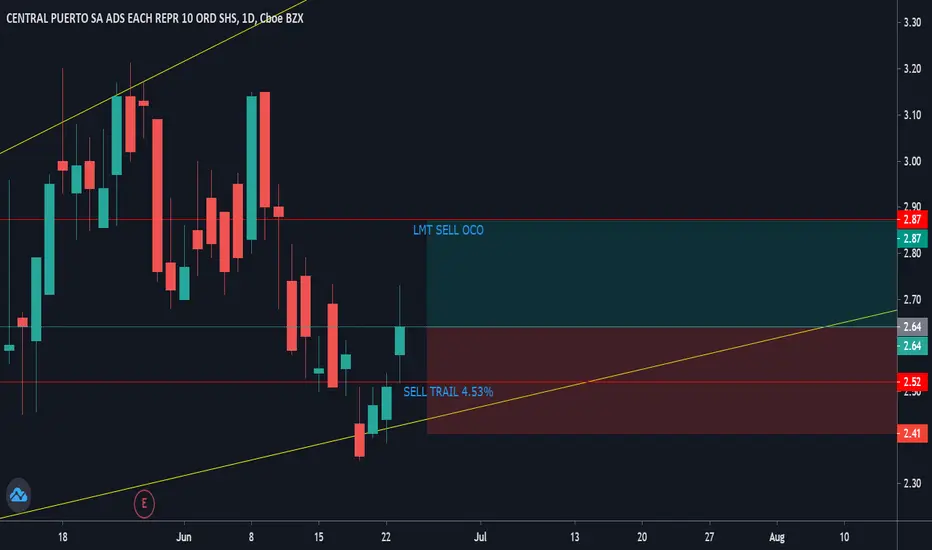
CEPU 9 RRR shortTrading Methodology:
1. An asymmetric bullish/bearish pennant is drawn using ascending and descending curved trend lines with a minimum of three price action touche points per line. The direction is determined by the previous trend.
2. The angle tool is applied from the earliest two trend touch points, beginning at the earliest touch point.
3. A trend-based Fibonacci retracement triangle is drawn starting from the earliest trend touch point and ending at the earliest touch point of the opposite trend line .
4. Based on the degree, of the earlier defined angle, the appropriate (and secret) levels are selected for the fibonacci retracement ; two levels for stop-loss and two levels for take-profit. The closest stop-loss level to the current price level is the top priority stop-loss. Though the secondary stop-loss level is often chosen for some markets such as FX and some equities in order to account for seldom unexpected resistance breaks. The greater target level is the top priority, and where majority of the shares are sold, though some may choose to close part of the position at the first target level or set it to be the stop-loss once price exceeds it. Entries should be laddered in around the levels closest of the yellow line.
This trading strategy can be applied to any market and time frame, and positions most often garner the greatest risk-to-reward ratio with the highest success rate. What more can you ask for? I will only be posting my unique trading strategy until EOY. I work solely with price action to identify pennants and apply unique trend-based fibonacci retracement levels for SL and TP levels. Reach out to me if you have any questions.


