CIEN watch $72 then 76: Serious Resistance zones that cause dip CIEN coming back ferociously from the tariff bottom.
About to break second Major Resistance, one more to go.
Very likely to see a dip from one of these major zones.
$71.88-72.53 is the immediate resistance breaking
$75.93-76.30 is the next resistance to try shorting.
$68.77-69.37 is the first support in case of a dip.
=================================================
.
CIEN trade ideas

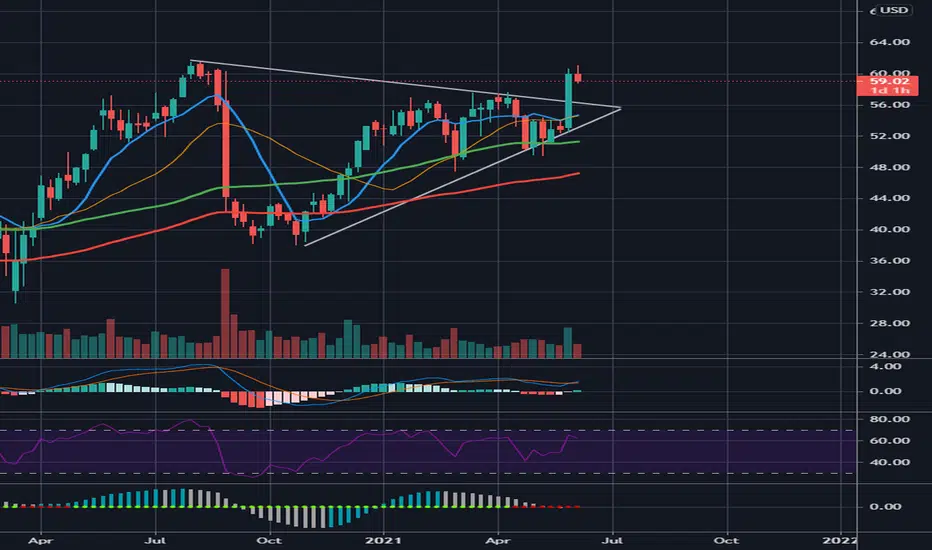
Getting ready for a big jumpPrice has been squeezing between the trendline and the short term upper vertex of the triangle. I think is going to break out, But I'm not jumping in because earning calls is 08/31 a few days from today. EC could trigger the break out, but I prefer to wait. Another option is to open a small position at current price, SL at 37.90m TP at 54 and wait for the EC. Add if EC doesn't move the price much up or down.

Ciena Corp - Buying for a rebound Ciena corp rebound at the bottom of the range after a break away gap is seeing some strong action after a morning star was seen closing above the BB

$CIEN pullback or reversal?The price has had 5 lower highs (and lower lows), might bounce at the Fibo. It still has enough upward momentum as per the Elder's Force Index 3&13 (not displayed).

Ciena Corp testing long term supportPrice action currently testing long term support, a weekly settlement below by more than 1% could offer a profitable shorting opportunity.

$ET $LIT $CIEN $SPY I OptionsSwing WatchlistET 1W I ET has been consolidating above $11.50 for some time. We have bullish unusual options activity betting on a retest of $12 by 10/21. Reports earnings on 08/02!
LIT 1D I Energy stocks and lithium stocks in general have been overperforming the market for the past two weeks. Watching for a breakout from this downtrend.
CIEN 4H I Bullish unusual activity picked up on our scanner. Possible breakout from this downtrend and fib extension. They are trading the $54c expiring on 06/03.
SPY 1D I A SPY made a double bottom near $385 last week and ended up breaking from its downtrend in just two sessions. Expecting resistance at $430, and support at $410.

28/4/2022 NYSE (CIEN)Short (Entry Price) below the black line and exit (Stop Loss) above the red line. Can take profit at the suggested Target Price.
Entry Price: $54.65
Target Price: $53.29
Stop Loss: $56.01

Double-Top Coming For Ciena?Based on historical movement, the trough could occur anywhere in the larger red box. The final targets are in the green boxes. The pending top should occur within the larger green box as has been the historical case. Half of all movement has ended in the smaller green box. In this instance, the signal indicated BUY on February 15, 2022 with a closing price of 68.53.
If this instance is successful, that means the stock should rise to at least 69.51 which is the bottom of the larger green box. Three-quarters of all successful signals have the stock rise 8.261% from the signal closing price. This percentage is the bottom of the smaller green box. Half of all successful signals have the stock rise 17.521% which is the end point of the black dotted arrow. One-quarter of all successful signals have the stock rise 27.504% from the signal closing price which is the top of the smaller green box. The maximum rise on record would see a move to the top of the larger green box. These are the same concepts for the levels in the red boxes as well.
The ends/vertical sides of the boxes are determined in a similar fashion. The peak of the rise can occur as soon as the next trading bar after signal close, while the max rise occurs within the limit of study at 35 trading bars after the signal. A 1% rise must occur over the next 35 trading bars in order to be considered a success. Three-quarters of successful movement occur after at least 9 trading bars; half occur within 20 trading bars, and one-quarter require at least 31 trading bars.
The black dotted arrow represents median historical movement. Medians are a good metric, but they are just one of many I use when forecasting future movement.
As always, the stock could decline the very next bar after the signal without looking back (therefore the red boxes would not come into play) or the stock may never decline (and the green boxes may never come into play).

CIEN good R/R hereI like this trade idea on Ciena corp - good risk reward IMO.
What was resistance appears to be support now, and with a pretty big VP Void above I'm looking for a move back up to 70 zone in the near term.
Long shares with 62 stop loss


1 Week Chart Price Target $66 Play long
Play long. Triangle already broke.
For more premium Ideas do subscribe me and follow me

CIEN: Breakout Confirmed, 17.6% Potential Profit!Description: CIEN is trending higher and in an uptrend meaning that highs are getting higher and lows are getting higher. The uptrend line on the chart and the Trending Band Indicator (which measures trend) supports the Long Position.
Stats:
1. Ideal buy range: $53.2 - $54.8
2. Take profit: $62.81
3. Stop Loss: $51.7
4. Risk To Reward: 1 / 6
5. Accuracy Rating: 92%

CIEN: Breakout Confirmed, 17.75% Potential Profit!Description: CIEN is trending higher and in an uptrend meaning that highs are getting higher and lows are getting higher. The uptrend line on the chart and the Trending Band Indicator (which measures trend) supports the Long Position.
Stats:
1. Ideal buy range: $53.3 - $54.9
2. Take profit: $62.95
3. Stop Loss: $51.75
4. Risk To Reward: 1 / 6
5. Accuracy Rating: 92%


$CIEN with a neutral outlook following earning releaseThe PEAD projected a neutral outlook for $CIEN after negative over reaction following earning release placing the stock in Drift C
If you would like to see the Drift for another stock please message us. Also click on the Like Button if this was useful and follow us or join us.


CIEN ER Gap Fill coming?
$CIEN is looking for gap fill. Beat Q3 ER but COVID guidance tanked the price.
Comparing to $CSCO who MISSED ($0.51 vs $0.70 EPS) their last ER Nov. 12 but gapped up.
$CIEN may gap up for similar reasons if the market sentiment is bullish around the ER.
Reminds me of $FSLY chart which is also looking to fill the gap.
The day of the ER seems to coincide with when NDX had the Sept 2020 correction, so this name seems to have been unfairly punished.
$CIEN has stronger relative strength vs NDX, so once we start filling the gap with higher relative volume, the price action may be faster than normal $1.21 ATR
Market is melting up and $CSCO popping on ER miss could be a preview of what will happen to this name.
Lowered expectation and over reaction on the pull back may help this name to pop.
Play - Bullish
Looking for consolidation and to cool off oversold RSI on Daily and 4Hr for the breakout into the gap.
Selling Credit put spread leading up to the ER for IV crush.
Dec. 18, 2020
$43-$41 credit put spread (currently 0.44 Cr for $200 margin)
Following ER, go long if reaction is positive and above $47.05
Jan 15, 2021 Call $47 (currently most liquid)
PT: $50, $55, $58
Company Profile
$CIEN is a challenger to $CSCO
Ciena Corp is a network strategy and technology company. It provides network hardware, software, and services thatsupport the transport, switching, aggregation, service delivery
and management of video, data, and voice traffic on communications networks
The sectoris outperforming the market thus farin 2020, with a gain of 20.9%. It also
outperformed in 2019, with a gain of 48.0%, and in 2018, with a loss of 1.6%.
-Dec 2, 2020
CIEN trades at 14.6-times our FY20 non-GAAP EPS forecast
and at 14.9-times our FY21 estimate.
- Argus Report, Jim Kelleber CFA
Sept 8th, 2020 - BUY

CEIN next weeks earnings releaseCIEN Corporation
6.98 up on the year, dropped in the last qtr to -15% from Septembers earnings
release due to covid effecting sales.
Target price of $52 range between $38-$61
Rsi sat at 72% though pointing
out stock being over bought before earnings release.

CIEN - Elliottwave analysis - Sell set upCIEN - It is in down trend and seems like started C wave down. So sell it on bounce up to 42.80-43.60 with stop level above 44.65 for target below 36 or even more downside as C wave.
Give thumbs up if you really like the trade idea.

CIEN - Elliottwave analysis - Sell set up CIEN - It is in C wave down after B wave complex sideway corrction finished. Sell with stops above 44.47 for down side target below 38 or lower.
Give thumbs up if you really like the trade idea.

