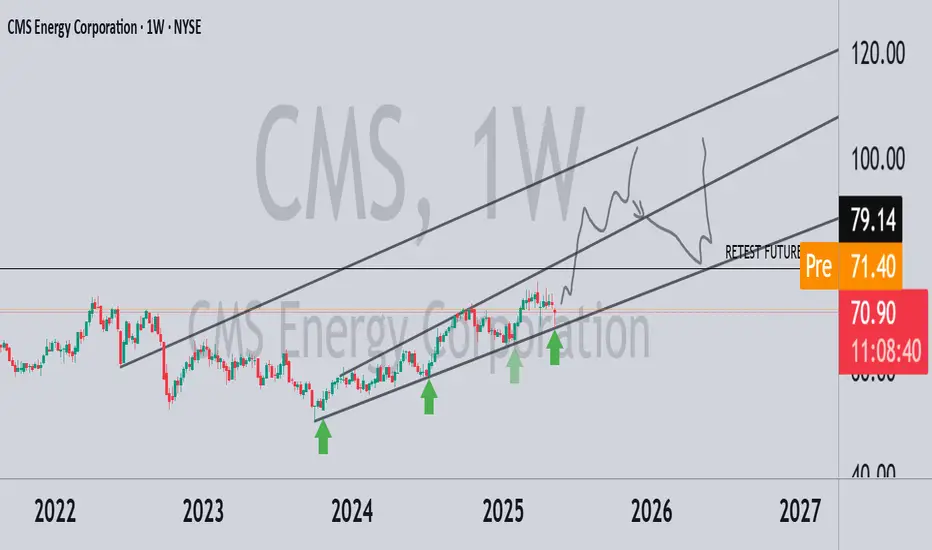
CMS Lining Up for a Major Long-Term Breakout strong bullish structure forming on the weekly timeframe for CMS Energy Corp (CMS). This stock has been respecting a well-defined ascending channel since mid-2022, consistently bouncing from the lower trendline — as highlighted by the green arrows.
✅ Four confirmed touches on the lower trendline (2022, 2023, and multiple in 2024–2025) show strong buying interest on dips.
📉 Current pullback appears to be a healthy retest within the bullish channel — the label “RETEST FUTURE” marks the probable bounce area.
🧱 Horizontal resistance around $79.00 could turn into support after a clean breakout.
📊 Price projection path suggests higher highs toward the $100–$120 range by late 2026 if momentum continues.
If CMS respects the trendline again and confirms a bounce, I'm targeting a multi-leg move toward the upper boundary of the channel. Tight stop loss below the lower trendline could offer great risk-reward ratio 🎯.
CMS trade ideas
Seeking for Opportunities in Advancing MomentumIn seeking opportunities in the prevalent momentum in the utility sector, I will consider going long on a breakout to the upside of the resistance level.

CMS: mean reversion tradeA price action above 55.50 supports a bullish trend direction.
Further bullish confirmation for a break above 57.00.
The target price is set at 58.50 (200-week simple moving average).
Also just above the mean of the linear regression channel pattern.
The stop-loss price is set at 54.40 (lower range of the linear regression channel pattern).

$CMS with a Bullish outlook following its earnings #Stocks The PEAD projected a Bullish outlook for $CMS after a Positive Under reaction following its earnings release placing the stock in drift A with an expected accuracy of 50%.

$CMS with a Bullish outlook following its earnings #Stocks The PEAD projected a Bullish outlook for $CMS after a Positive Under reaction following its earnings release placing the stock in drift A with an expected accuracy of 33.33%.

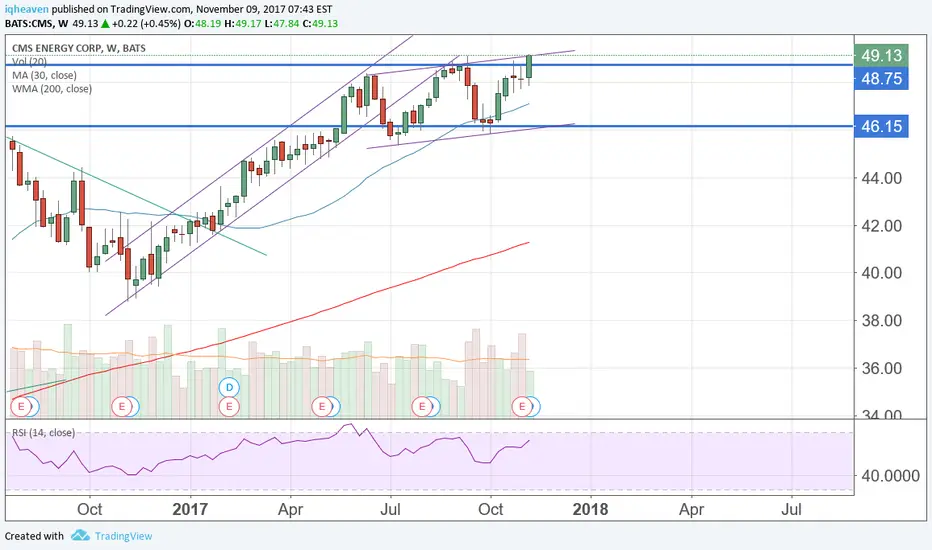
CMS New All Time HighsCMS made another New All Time High on Friday
2 Year Long Base
Price above 200 DMA
Pays out Dividends

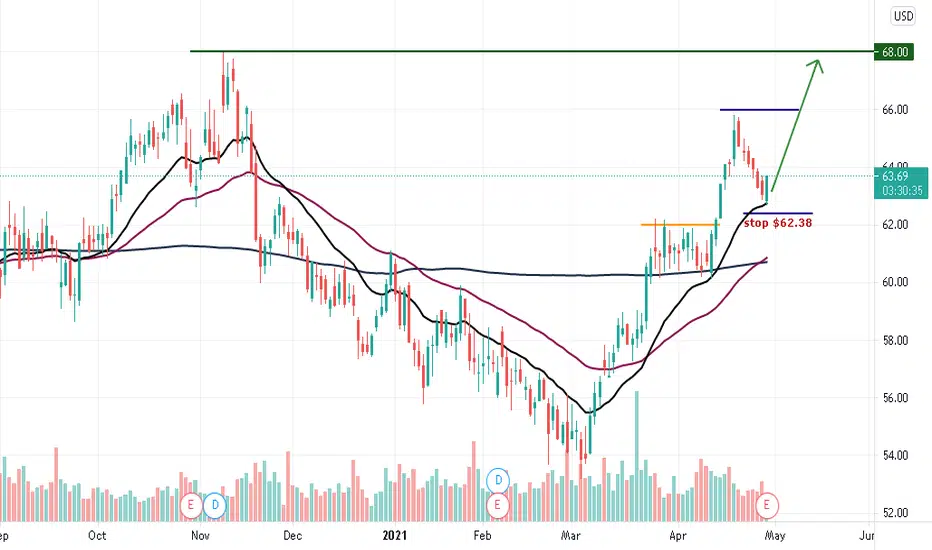
Power of EMA20 and good earnings report The stock holds EMA20 and bouncing back, I'm gonna enter into a lnog position with the strong support $62.38. Price action shows that it's gonna go higher after break above resistance! Good risk/reward ratio!
CMS ENERGY CORP is to BUY DailyHey traders, CMS ENERGY CORP is in a bullish push, CMS ENERGY CORP is heading for its latest high. It can turn around if the sellers are back to start falling, or either it's the buyers co-ordinating the price, to push up on decision and price areas.
Please LIKE & FOLLOW, thank you!

CMCSA - DAILY CHARTHi, today we are going to talk about the Comcast Corporation and its current landscape.
Comcast Corporation enters in the spotlight of the market as T- Mobile has announced that John Legere will leave the seat of CEO of the company, been replaced by Mike Sievert in April 2020. The former CEO that has been leading the company since 2012 will remain a member of the board. Its replacement Mike Sievert is the current president and chief operating officer (COO). The transaction period seems set to be smooth as Legere will assist with the acquisition process of its rival company Sprint, that it's controlled by Softbank that also holds control of WeWork, where Legere its quoted to be the new CEO. The acquisition of Sprint (an $26 billion deal) makes the T-Mobile step up its potential of competition in the Telecommunications Sector, possibly imposing a reducing of market share for Comcast Corporation.
Thank you for reading and leave your comments if you like.
To have access to our exclusive contents, join the Traders Heaven today! Link Below.
Disclaimer: All content of Golden Dragon has only educational and informational purposes, and never should be used or take it as financial advice.

CMS: Sort opportunityAn intraday high potential, Back Tested Sort Analysis.
We ll try to enter into the correction of the uptrend movement.
DETAILS ON THE CHART
NOTE: Entry range area above the entry point, is calculated upon 80% of the recorded pullback back tested past performances
DISCLAIMER: This is a technical analysis study, not an advice or recommendation to invest money on.

$CMS - The fucking TA I live for Son there's something up w/ the market with the types of charts I'm seeing. I wouldn't consider getting long on SHIT until after today. 6 months I've gone without seeing any familiar setup that gets chewed up & flushed out just to stage a fake rally but - there must be some type of life in the market if I find 3 breakout ready ass setups without even trying to look @ a bulls perspective. Realistically - this type of setup gets flushed out real bad real quick but that's not until after it rips. Yellow line marks either the top, or the start of a rip to 314% fib (May / may not be 1-2 candles late). Red line should mark the start of a serious breakdown - with high confidence. Long PT $53 just to be safe, short PT if you have time to sit on puts - anything <$47.

Bearish SharkBearish Shark with bearish divergence. The BC extension is a little off, but overall a great looking pattern!

CMS Detected possible increase in guidanceCMS: cms energy corp
2018-02-14 07:00:40
Detected possible increase in guidance


CMS Energy biased higher Shifting into a defensive stance, CMS is looking good on a dual time frame momentum standpoint. After a successful pullback retest of the recent breakout, this utility stock looks ready to roll
